APC 2013 Annual Report Download - page 80
Download and view the complete annual report
Please find page 80 of the 2013 APC annual report below. You can navigate through the pages in the report by either clicking on the pages listed below, or by using the keyword search tool below to find specific information within the annual report.-
 1
1 -
2
-
3
-
4
-
5
-
6
-
7
-
8
-
9
-
10
-
11
-
12
-
13
-
14
-
15
-
16
-
17
-
18
-
19
-
20
-
21
-
22
-
23
-
24
-
25
-
26
-
27
-
28
-
29
-
30
-
31
-
32
-
33
-
34
-
35
-
36
-
37
-
38
-
39
-
40
-
41
-
42
-
43
-
44
-
45
-
46
-
47
-
48
-
49
-
50
-
51
-
52
-
53
-
54
-
55
-
56
-
57
-
58
-
59
-
60
-
61
-
62
-
63
-
64
-
65
-
66
-
67
-
68
-
69
-
 70
70 -
 71
71 -
 72
72 -
 73
73 -
 74
74 -
 75
75 -
 76
76 -
 77
77 -
 78
78 -
 79
79 -
 80
80 -
 81
81 -
 82
82 -
 83
83 -
 84
84 -
 85
85 -
 86
86 -
 87
87 -
 88
88 -
 89
89 -
 90
90 -
91
-
92
-
93
-
94
-
95
-
96
-
97
-
98
-
99
-
100
-
101
-
102
-
103
-
104
-
105
-
106
-
107
-
108
-
109
-
110
-
111
-
112
-
113
-
114
-
115
-
116
-
117
-
118
-
119
-
120
-
121
-
122
-
123
-
124
-
125
-
126
-
127
-
128
-
129
-
130
-
131
-
132
-
133
-
134
-
135
-
136
-
137
-
138
-
139
-
140
-
141
-
142
-
143
-
144
-
145
-
146
-
147
-
148
-
149
-
150
-
151
-
152
-
153
-
154
-
155
-
156
-
157
-
158
-
159
-
160
-
161
-
162
-
163
-
164
-
165
-
166
-
167
-
168
-
169
-
170
-
171
-
172
-
173
-
174
-
175
-
176
-
177
-
178
-
179
-
180
-
181
-
182
-
183
-
184
-
185
-
186
-
187
-
188
-
189
-
190
-
191
-
192
-
193
-
194
-
195
-
196
-
197
-
198
-
199
-
200
-
201
-
202
-
203
-
204
-
205
-
206
-
207
-
208
-
209
-
210
-
211
-
212
-
213
-
214
-
215
-
216
-
217
-
218
-
219
-
220
-
221
-
222
-
223
-
224
-
225
-
226
-
227
-
228
-
229
-
230
-
231
-
232
-
233
-
234
-
235
-
236
-
237
-
238
-
239
-
240
-
241
-
242
-
243
-
244
-
245
-
246
-
247
-
248
-
249
-
250
-
251
-
252
-
253
-
254
-
255
-
256
-
257
-
258
-
259
-
260
-
261
-
262
-
263
-
264
-
265
-
266
-
267
-
268
-
269
-
270
-
271
-
272
-
273
-
274
-
275
-
276
-
277
-
278
-
279
-
280
-
281
-
282
-
283
-
284
-
285
-
286
-
287
-
288
-
289
-
290
-
291
-
292
-
293
-
294
-
295
-
296
-
297
-
298
-
299
-
300
-
301
-
302
-
303
-
304
-
305
-
306
-
307
-
308
-
309
-
310
-
311
-
312
-
313
-
314
-
315
-
316
-
317
-
318
-
319
-
320
-
321
-
322
-
323
-
324
-
325
-
326
-
327
-
328
-
329
-
330
-
331
-
332
 |
 |

2SUSTAINABLE DEVELOPMENT
SCHNEIDER ELECTRIC’S COMMITMENT TO ENVIRONMENTAL PERFORMANCE
Eco-Production
3.4
Approach
of2013 in relation to2012 on a like-for-like basis. The target of
3.3% has been exceeded. Note: Water used for cooling is not
Schneider Electric has rolled out the ISO14001 certification for all included in this calculation for2013.
its manufacturing sites comprised of more than 50people and Water is not generally a critical resource in Schneider Electric’s
large tertiary sites. All these sites contribute to reporting and industrial processes.
therefore to the Group targets. The certification objective helps
focus continuous efforts to reduce the main environmental impacts Water is essentially used for sanitary purposes, sometimes for
of the sites, shown in the table on pages 113-114: cooling and in certain sites for surface treatment. In the last case,
industrial water discharge is subject to treatment that is suitable in
energy consumption;
l
terms of its pollutant potential and discharge into the natural
CO2emissions;
l
environment or in a plant subject to a monitoring plan.
amount of waste produced;
l
As Schneider Electric industrial production is mainly based on
percentage of waste recovered;
l
manual assembly processes or automatic processes for electrical
components and subsets, it has low water consumption and a
consumption of water;
l
negligible impact on water quality.
VOC emissions (Volatile Organic Compounds).
l
Nevertheless, in2011 the Group initiated an analysis of industrial
Action plans
site positions relative to water stress in different regions throughout
the world using the WBCSD tool (World Business Council for
Sustainable Development).
ISO14001 certification of Group sites
The company’s “Everblue” project was launched in2012 and
designed to better understand the uses of water within the Group,
As soon as the ISO14001 environmental management standard
and therefore its exposure to water-related risks and reduce
was published in1996, Schneider Electric decided to certify its
consumption. Particular attention is paid to the
sites. For several years the Group has demanded that all industrial
highest-consumption sites and those located in areas of water
and logistic sites comprised of more than 50people be ISO14001
stress, where the objectives of reducing water consumption
certified within two years of their acquisition or creation.
accompanied by specific action plans are reviewed site by site on
The extension of this internal directive to the major tertiary sites a monthly basis since January2013.
was launched in2010. The headquarters of the Group in
In 2013 EverBlue encompasses 45 sites that represent 53% of the
Rueil-Malmaison, France was certified in2010. This extension was
Group total consumption.
reaffirmed for the 2012-2014 period for all tertiary sites comprised
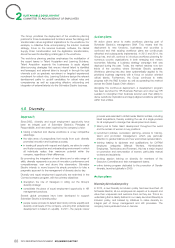
of more than 500people. Thanks to a new reporting system, the detailed water usage is
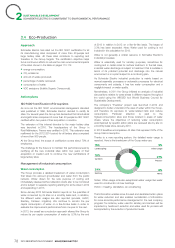
reported. Here is the breakdown of the Group water use:
At the Group level, the scope of certification covers about 70% of
employees.
10%
Canteen
8%
HVAC
27%
Process
34%
Sanitary
15%
Landscaping
5%
Other usage
The challenge for the future is to maintain this performance level by
certifying all the new industrial sites within two years of their
acquisition or creation and to continue the new certifications of
large tertiary sites.
Management of industrial consumption
Water consumption
The Group provides a detailed breakdown of water consumption
that takes into account groundwater and water from the public
network. Water drawn for the sole purpose of cooling and
Notes: Other usage includes exceptional water usage like water
immediately released without alteration starts also to be monitored
used for construction of new buildings
and is subject to separate reporting starting for some sites in2012
HVAC =Heating, Ventilation, Air conditioning
and expanding in 2013.
Since January2013 Schneider Electric reports on the quantities of That information enables more focused and dedicated action plans
water consumed by its sites on a monthly basis and, in addition, for water reduction and also enables normalization of information
the different water usages are also reported (process, HVAC, for more accurate performance management in the next company
Sanitary, Canteen, Irrigation). We continue to monitor the per program: for instance, water used for sanitary and canteen will be
capita consumption of water on a like-for-like basis in order to impacted by headcount evolution and water used for process will
evaluate the improvement performance from one year to the next. be impacted by the evolution of production levels.
In2013, the overall eco-production approach allowed the Group to
reduce its per capita consumption of water by 9,3% by the end
78 2013 REGISTRATION DOCUMENT SCHNEIDER ELECTRIC