APC 2013 Annual Report Download - page 284
Download and view the complete annual report
Please find page 284 of the 2013 APC annual report below. You can navigate through the pages in the report by either clicking on the pages listed below, or by using the keyword search tool below to find specific information within the annual report.-
 1
1 -
2
-
3
-
4
-
5
-
6
-
7
-
8
-
9
-
10
-
11
-
12
-
13
-
14
-
15
-
16
-
17
-
18
-
19
-
20
-
21
-
22
-
23
-
24
-
25
-
26
-
27
-
28
-
29
-
30
-
31
-
32
-
33
-
34
-
35
-
36
-
37
-
38
-
39
-
40
-
41
-
42
-
43
-
44
-
45
-
46
-
47
-
48
-
49
-
50
-
51
-
52
-
53
-
54
-
55
-
56
-
57
-
58
-
59
-
60
-
61
-
62
-
63
-
64
-
65
-
66
-
67
-
68
-
69
-
70
-
71
-
72
-
73
-
74
-
75
-
76
-
77
-
78
-
79
-
80
-
81
-
82
-
83
-
84
-
85
-
86
-
87
-
88
-
89
-
90
-
91
-
92
-
93
-
94
-
95
-
96
-
97
-
98
-
99
-
100
-
101
-
102
-
103
-
104
-
105
-
106
-
107
-
108
-
109
-
110
-
111
-
112
-
113
-
114
-
115
-
116
-
117
-
118
-
119
-
120
-
121
-
122
-
123
-
124
-
125
-
126
-
127
-
128
-
129
-
130
-
131
-
132
-
133
-
134
-
135
-
136
-
137
-
138
-
139
-
140
-
141
-
142
-
143
-
144
-
145
-
146
-
147
-
148
-
149
-
150
-
151
-
152
-
153
-
154
-
155
-
156
-
157
-
158
-
159
-
160
-
161
-
162
-
163
-
164
-
165
-
166
-
167
-
168
-
169
-
170
-
171
-
172
-
173
-
174
-
175
-
176
-
177
-
178
-
179
-
180
-
181
-
182
-
183
-
184
-
185
-
186
-
187
-
188
-
189
-
190
-
191
-
192
-
193
-
194
-
195
-
196
-
197
-
198
-
199
-
200
-
201
-
202
-
203
-
204
-
205
-
206
-
207
-
208
-
209
-
210
-
211
-
212
-
213
-
214
-
215
-
216
-
217
-
218
-
219
-
220
-
221
-
222
-
223
-
224
-
225
-
226
-
227
-
228
-
229
-
230
-
231
-
232
-
233
-
234
-
235
-
236
-
237
-
238
-
239
-
240
-
241
-
242
-
243
-
244
-
245
-
246
-
247
-
248
-
249
-
250
-
251
-
252
-
253
-
254
-
255
-
256
-
257
-
258
-
259
-
260
-
261
-
262
-
263
-
264
-
265
-
266
-
267
-
268
-
269
-
270
-
271
-
272
-
273
-
 274
274 -
 275
275 -
 276
276 -
 277
277 -
 278
278 -
 279
279 -
 280
280 -
 281
281 -
 282
282 -
 283
283 -
 284
284 -
 285
285 -
 286
286 -
 287
287 -
 288
288 -
 289
289 -
 290
290 -
 291
291 -
 292
292 -
 293
293 -
 294
294 -
295
-
296
-
297
-
298
-
299
-
300
-
301
-
302
-
303
-
304
-
305
-
306
-
307
-
308
-
309
-
310
-
311
-
312
-
313
-
314
-
315
-
316
-
317
-
318
-
319
-
320
-
321
-
322
-
323
-
324
-
325
-
326
-
327
-
328
-
329
-
330
-
331
-
332
 |
 |

7INFORMATION ON THE COMPANY AND ITS CAPITAL
EMPLOYEE INCENTIVE PLANS – EMPLOYEE SHAREHOLDING
Employee incentive plans –
5.
Employeeshareholding
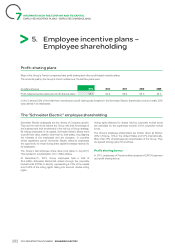
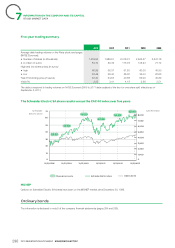
Profit-sharing plans
Most of the Group’s French companies have profit-sharing and other profit-based incentive plans.
The amounts paid by the Group’s French entities over the last five years were:
(inmillions of euros) 2013 2012 2011 2010 2009
Profit-based incentive plans and profit-sharing plans 76.7 50.9 59.9 56.5 48.5
In2013, almost 53% of the total from incentives and profit-sharing was invested in the Schneider Electric shareholder fund and nearly 25%
was cashed in by employees.
The “Schneider Electric” employee shareholding
Schneider Electric employees are the drivers of Company growth. Voting rights attached to shares held by corporate mutual funds
They are the main force behind the Group with their knowledge of are exercised by the supervisory boards of the corporate mutual
the business and their involvement in the roll-out of Group strategy. funds.
By linking employees to its capital, Schneider Electric allows them The Group’s employee shareholders are broken down as follows:
to profit from value creation other than by their salary, thus aligning 39% in France, 10% in the United States and 51% internationally.
the interests of the employees and the company. In countries More than 37% of employees are shareholders of the Group. They
where regulations permit, Schneider Electric offers its employees are spread among nearly 60countries.
the opportunity to invest during share capital increases reserved to
Profit sharing bonus
its employees.
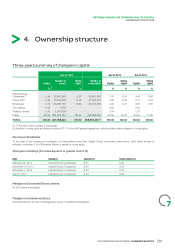
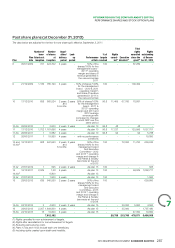
The Group's last employee share issue took place in July2013.
This resulted in a subscription of 2.7million shares. In2013, employees of French entities received a EUR100 payment
At December31, 2013, Group employees held a total of as a profit sharing bonus.
23.5million Schneider ElectricSA shares through the corporate
mutual funds (FCPE) or directly, representing 4.19% of the capital
and 6.52% of the voting rights, taking into account double voting
rights.
282 2013 REGISTRATION DOCUMENT SCHNEIDER ELECTRIC