APC 2013 Annual Report Download - page 115
Download and view the complete annual report
Please find page 115 of the 2013 APC annual report below. You can navigate through the pages in the report by either clicking on the pages listed below, or by using the keyword search tool below to find specific information within the annual report.-
 1
1 -
2
-
3
-
4
-
5
-
6
-
7
-
8
-
9
-
10
-
11
-
12
-
13
-
14
-
15
-
16
-
17
-
18
-
19
-
20
-
21
-
22
-
23
-
24
-
25
-
26
-
27
-
28
-
29
-
30
-
31
-
32
-
33
-
34
-
35
-
36
-
37
-
38
-
39
-
40
-
41
-
42
-
43
-
44
-
45
-
46
-
47
-
48
-
49
-
50
-
51
-
52
-
53
-
54
-
55
-
56
-
57
-
58
-
59
-
60
-
61
-
62
-
63
-
64
-
65
-
66
-
67
-
68
-
69
-
70
-
71
-
72
-
73
-
74
-
75
-
76
-
77
-
78
-
79
-
80
-
81
-
82
-
83
-
84
-
85
-
86
-
87
-
88
-
89
-
90
-
91
-
92
-
93
-
94
-
95
-
96
-
97
-
98
-
99
-
100
-
101
-
102
-
103
-
104
-
 105
105 -
 106
106 -
 107
107 -
 108
108 -
 109
109 -
 110
110 -
 111
111 -
 112
112 -
 113
113 -
 114
114 -
 115
115 -
 116
116 -
 117
117 -
 118
118 -
 119
119 -
 120
120 -
 121
121 -
 122
122 -
 123
123 -
 124
124 -
 125
125 -
126
-
127
-
128
-
129
-
130
-
131
-
132
-
133
-
134
-
135
-
136
-
137
-
138
-
139
-
140
-
141
-
142
-
143
-
144
-
145
-
146
-
147
-
148
-
149
-
150
-
151
-
152
-
153
-
154
-
155
-
156
-
157
-
158
-
159
-
160
-
161
-
162
-
163
-
164
-
165
-
166
-
167
-
168
-
169
-
170
-
171
-
172
-
173
-
174
-
175
-
176
-
177
-
178
-
179
-
180
-
181
-
182
-
183
-
184
-
185
-
186
-
187
-
188
-
189
-
190
-
191
-
192
-
193
-
194
-
195
-
196
-
197
-
198
-
199
-
200
-
201
-
202
-
203
-
204
-
205
-
206
-
207
-
208
-
209
-
210
-
211
-
212
-
213
-
214
-
215
-
216
-
217
-
218
-
219
-
220
-
221
-
222
-
223
-
224
-
225
-
226
-
227
-
228
-
229
-
230
-
231
-
232
-
233
-
234
-
235
-
236
-
237
-
238
-
239
-
240
-
241
-
242
-
243
-
244
-
245
-
246
-
247
-
248
-
249
-
250
-
251
-
252
-
253
-
254
-
255
-
256
-
257
-
258
-
259
-
260
-
261
-
262
-
263
-
264
-
265
-
266
-
267
-
268
-
269
-
270
-
271
-
272
-
273
-
274
-
275
-
276
-
277
-
278
-
279
-
280
-
281
-
282
-
283
-
284
-
285
-
286
-
287
-
288
-
289
-
290
-
291
-
292
-
293
-
294
-
295
-
296
-
297
-
298
-
299
-
300
-
301
-
302
-
303
-
304
-
305
-
306
-
307
-
308
-
309
-
310
-
311
-
312
-
313
-
314
-
315
-
316
-
317
-
318
-
319
-
320
-
321
-
322
-
323
-
324
-
325
-
326
-
327
-
328
-
329
-
330
-
331
-
332
 |
 |

SUSTAINABLE DEVELOPMENT
INDICATORS
Indicators
7.
Environmental indicators
7.1
2
The indicators below have a Group scope. They illustrate our Schneider Electric provides readers two pieces of information so
industrial and logistics sites’ environmental consumption, emission that environmental performance can be compared from one year
and waste in addition to certain major tertiary sites. The scope of to the next:
environmental reporting is that of ISO14001 certified sites, and one part publishing constant scope indicators;
l
certain non-certified sites on a voluntary basis and without and another part publishing indicators per employee to correct
l
interruption in time. All of the industrial and logistics sites with more the changes in the company’s activities. The sites’ workforce
than 50people and the major tertiary sites with more than includes Schneider Electric employees (fixed-term, permanent
500people must be ISO14001 certified within two years after their and work/study participants), temporary staff and on-site
acquisition or creation. A difference can be established with the subcontractors.
scope of financial consolidation. The scope of environmental Comments on the indicators are included in the corresponding
reporting covers about 70% of the Group headcount. chapters.
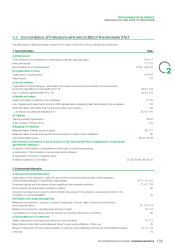
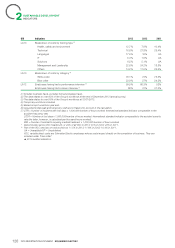
ISO14001 certification of sites
2013 2012 2011
Number of ISO14001 Certified Sites 280 ▲280 273
Industrial and logistics sites UP 258 253
Tertiary sites UP 22 20
New sites certified this year 20 11 36
Certified sites that have closed or consolidated this year 20 4 14
▲ 2013 audited indicator.
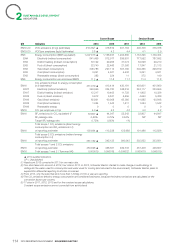
Group sites consumption, emissions and waste
Current Scope Constant Scope
GRI Indicators 2013 2012 2011 2013 2012
Number of Participating sites 281 ▲283 281 260 260
Number of employees 108,126 ▲98,1231102,991 99,776 96,438
EN22 Waste produced (in t) 139,044 ▲134,814 135,392 135,619 130,341
Of which hazardous waste 4% NP NP NP NP
EN22 Waste produced per employee (in t/p) 1.3 ▲1.4 1.3 1.36 1.35
EN22 Waste recovered (in t) 120,490 ▲115,382 112,611 117,839 111,182
EN22 Percentage of waste recovered 86.7% ▲85.6% 83% 86.9% 85.3%
Of which metal waste recovered 99.4% NP NP NP NP
Target percentage of waste recovered - - - 85% -
EN8 Water withdrawn for consumption (m3)2,377,680 ▲2,456,716 2,863,934 2,246,017 2,394,120
Of which public water (m3) 1,928,151 1,973,348 2,081,770 NP NP
Of which ground water (m3) 397,843 483,367 782,164 NP NP
Of which surface water (m3) 20,667 - - NP NP
Of which other sources (m3) 31,019 - - NP NP
EN8 Water consumption/employee (m3/p) 22.0 ▲24.8 27.8 22.5 24.8
Change in water consumption per employee - - - -9.3% -
Target consumption of water per employee - - - -3.3% -
EN8 Water withdrawn for cooling (m3)2727,679▲722,709 NP NP NP
restituted w/o impact
113
DOCUMENT DE RÉFÉRENCE 2013 SCHNEIDER ELECTRIC