APC 2013 Annual Report Download - page 199
Download and view the complete annual report
Please find page 199 of the 2013 APC annual report below. You can navigate through the pages in the report by either clicking on the pages listed below, or by using the keyword search tool below to find specific information within the annual report.-
 1
1 -
2
-
3
-
4
-
5
-
6
-
7
-
8
-
9
-
10
-
11
-
12
-
13
-
14
-
15
-
16
-
17
-
18
-
19
-
20
-
21
-
22
-
23
-
24
-
25
-
26
-
27
-
28
-
29
-
30
-
31
-
32
-
33
-
34
-
35
-
36
-
37
-
38
-
39
-
40
-
41
-
42
-
43
-
44
-
45
-
46
-
47
-
48
-
49
-
50
-
51
-
52
-
53
-
54
-
55
-
56
-
57
-
58
-
59
-
60
-
61
-
62
-
63
-
64
-
65
-
66
-
67
-
68
-
69
-
70
-
71
-
72
-
73
-
74
-
75
-
76
-
77
-
78
-
79
-
80
-
81
-
82
-
83
-
84
-
85
-
86
-
87
-
88
-
89
-
90
-
91
-
92
-
93
-
94
-
95
-
96
-
97
-
98
-
99
-
100
-
101
-
102
-
103
-
104
-
105
-
106
-
107
-
108
-
109
-
110
-
111
-
112
-
113
-
114
-
115
-
116
-
117
-
118
-
119
-
120
-
121
-
122
-
123
-
124
-
125
-
126
-
127
-
128
-
129
-
130
-
131
-
132
-
133
-
134
-
135
-
136
-
137
-
138
-
139
-
140
-
141
-
142
-
143
-
144
-
145
-
146
-
147
-
148
-
149
-
150
-
151
-
152
-
153
-
154
-
155
-
156
-
157
-
158
-
159
-
160
-
161
-
162
-
163
-
164
-
165
-
166
-
167
-
168
-
169
-
170
-
171
-
172
-
173
-
174
-
175
-
176
-
177
-
178
-
179
-
180
-
181
-
182
-
183
-
184
-
185
-
186
-
187
-
188
-
 189
189 -
 190
190 -
 191
191 -
 192
192 -
 193
193 -
 194
194 -
 195
195 -
 196
196 -
 197
197 -
 198
198 -
 199
199 -
 200
200 -
 201
201 -
 202
202 -
 203
203 -
 204
204 -
 205
205 -
 206
206 -
 207
207 -
 208
208 -
 209
209 -
210
-
211
-
212
-
213
-
214
-
215
-
216
-
217
-
218
-
219
-
220
-
221
-
222
-
223
-
224
-
225
-
226
-
227
-
228
-
229
-
230
-
231
-
232
-
233
-
234
-
235
-
236
-
237
-
238
-
239
-
240
-
241
-
242
-
243
-
244
-
245
-
246
-
247
-
248
-
249
-
250
-
251
-
252
-
253
-
254
-
255
-
256
-
257
-
258
-
259
-
260
-
261
-
262
-
263
-
264
-
265
-
266
-
267
-
268
-
269
-
270
-
271
-
272
-
273
-
274
-
275
-
276
-
277
-
278
-
279
-
280
-
281
-
282
-
283
-
284
-
285
-
286
-
287
-
288
-
289
-
290
-
291
-
292
-
293
-
294
-
295
-
296
-
297
-
298
-
299
-
300
-
301
-
302
-
303
-
304
-
305
-
306
-
307
-
308
-
309
-
310
-
311
-
312
-
313
-
314
-
315
-
316
-
317
-
318
-
319
-
320
-
321
-
322
-
323
-
324
-
325
-
326
-
327
-
328
-
329
-
330
-
331
-
332
 |
 |

CONSOLIDATED FINANCIALSTATEMENTS ATDECEMBER 31, 2013
NOTES TO THE CONSOLIDATED FINANCIAL STATEMENTS
Changes in the scope of consolidation
Note2
The Group’s consolidated financial statements for the year ended December31, 2013 enclose the financial statements of companies listed
in the note32. The scope of consolidation for the year ended December31, 2013 can be summarized as follows:
Number of active companies Dec.31, 2013 Dec.31, 2012
Parent company and fully consolidated subsidiaries 543 582
Proportionally consolidated companies 33
Companies accounted for by the equity method 46
TOTAL 550 591
2.1 – Follow-up on 2012 acquisitions assets in the amount of EUR19million (customer relationships)
this asset was valued by an independent expert. Contingent
In accordance with IFRS3R, Schneider Electric valued the liabilities were recognized for a total amount of EUR1million.
assets acquired and liabilities assumed at their fair value on the Comparative data in2012 did not require a change in2013
date of acquisition. because the impacts related to changes in fair value recognized
The final allocation of the acquisition of M&C Energy Group as part of the acquisition price were not significant across the
(June12, 2012) led principally to the recognition of intangible Schneider Electric Group balance sheet and income statement.
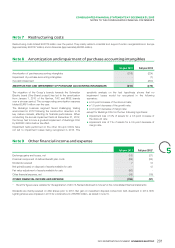
2.2 – Acquisitions during the year
The total amount of acquisitions during the year came to EUR294million, net of cash and cash equivalents acquired.
Dec.31, 2013 Dec.31, 2012
Acquisitions (330) (249)
Cash and cash equivalents paid (336) (268)
Cash and cash equivalents acquired/(paid) 619
Disposals 36 7
Other operations --
NET FINANCIAL INVESTMENT (294) (242)
5
Schneider Electric acquired the additional 50% shares of The provisional allocation from the acquisition of Electroshield –
Electroshield – TM Samara on March28, 2013, in accordance TM Samara led principally to the recognition of revaluations of
with the 2010 purchase agreement for the price of RUB tangible assets estimated by independent experts in the amount
10.2billion as agreed then. of EUR15million and contingent liabilities for a total amount of
EUR106million. The goodwill is not tax-deductible.
Since then, Electroshield – TM Samara is consolidated with full
consolidation method. On December31, 2013, the main elements of the provisional
computation are:
The takeover of Electroshield – TM Samara by Schneider
Electric implies, in accordance with IFRS3 revised standard on contingent liabilities, for the identification of risks are not
l
business combinations: completed at the closing date;
tangible assets, because the estimated fair value of these
l
to revaluate at fair value through profit and loss the 50%
l
assets is in progress;
share formerly held and the equity method investment until
intangible assets, because the assumptions used to value
l
then;
these assets will be refined in2014.
to account for at fair value the total identifiable assets and
l
liabilities of Electroshield as well as goodwill, for the net
amount thus determined compared to the scope entry value.
197
2013 REGISTRATION DOCUMENT SCHNEIDER ELECTRIC