APC 2013 Annual Report Download - page 52
Download and view the complete annual report
Please find page 52 of the 2013 APC annual report below. You can navigate through the pages in the report by either clicking on the pages listed below, or by using the keyword search tool below to find specific information within the annual report.-
 1
1 -
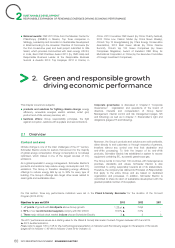
2
-
3
-
4
-
5
-
6
-
7
-
8
-
9
-
10
-
11
-
12
-
13
-
14
-
15
-
16
-
17
-
18
-
19
-
20
-
21
-
22
-
23
-
24
-
25
-
26
-
27
-
28
-
29
-
30
-
31
-
32
-
33
-
34
-
35
-
36
-
37
-
38
-
39
-
40
-
41
-
 42
42 -
 43
43 -
 44
44 -
 45
45 -
 46
46 -
 47
47 -
 48
48 -
 49
49 -
 50
50 -
 51
51 -
 52
52 -
 53
53 -
 54
54 -
 55
55 -
 56
56 -
 57
57 -
 58
58 -
 59
59 -
 60
60 -
 61
61 -
 62
62 -
63
-
64
-
65
-
66
-
67
-
68
-
69
-
70
-
71
-
72
-
73
-
74
-
75
-
76
-
77
-
78
-
79
-
80
-
81
-
82
-
83
-
84
-
85
-
86
-
87
-
88
-
89
-
90
-
91
-
92
-
93
-
94
-
95
-
96
-
97
-
98
-
99
-
100
-
101
-
102
-
103
-
104
-
105
-
106
-
107
-
108
-
109
-
110
-
111
-
112
-
113
-
114
-
115
-
116
-
117
-
118
-
119
-
120
-
121
-
122
-
123
-
124
-
125
-
126
-
127
-
128
-
129
-
130
-
131
-
132
-
133
-
134
-
135
-
136
-
137
-
138
-
139
-
140
-
141
-
142
-
143
-
144
-
145
-
146
-
147
-
148
-
149
-
150
-
151
-
152
-
153
-
154
-
155
-
156
-
157
-
158
-
159
-
160
-
161
-
162
-
163
-
164
-
165
-
166
-
167
-
168
-
169
-
170
-
171
-
172
-
173
-
174
-
175
-
176
-
177
-
178
-
179
-
180
-
181
-
182
-
183
-
184
-
185
-
186
-
187
-
188
-
189
-
190
-
191
-
192
-
193
-
194
-
195
-
196
-
197
-
198
-
199
-
200
-
201
-
202
-
203
-
204
-
205
-
206
-
207
-
208
-
209
-
210
-
211
-
212
-
213
-
214
-
215
-
216
-
217
-
218
-
219
-
220
-
221
-
222
-
223
-
224
-
225
-
226
-
227
-
228
-
229
-
230
-
231
-
232
-
233
-
234
-
235
-
236
-
237
-
238
-
239
-
240
-
241
-
242
-
243
-
244
-
245
-
246
-
247
-
248
-
249
-
250
-
251
-
252
-
253
-
254
-
255
-
256
-
257
-
258
-
259
-
260
-
261
-
262
-
263
-
264
-
265
-
266
-
267
-
268
-
269
-
270
-
271
-
272
-
273
-
274
-
275
-
276
-
277
-
278
-
279
-
280
-
281
-
282
-
283
-
284
-
285
-
286
-
287
-
288
-
289
-
290
-
291
-
292
-
293
-
294
-
295
-
296
-
297
-
298
-
299
-
300
-
301
-
302
-
303
-
304
-
305
-
306
-
307
-
308
-
309
-
310
-
311
-
312
-
313
-
314
-
315
-
316
-
317
-
318
-
319
-
320
-
321
-
322
-
323
-
324
-
325
-
326
-
327
-
328
-
329
-
330
-
331
-
332
 |
 |

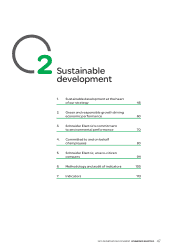
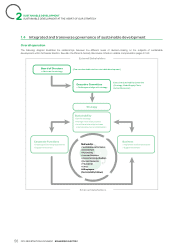
2SUSTAINABLE DEVELOPMENT
SUSTAINABLE DEVELOPMENT AT THE HEART OF OUR STRATEGY
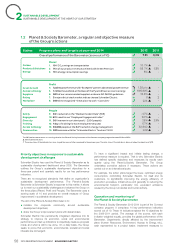
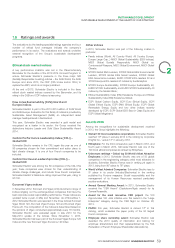
Planet&Society Barometer, a regular and objective measure
1.2
oftheGroup’s actions
Planet
1. 10% CO
2
savings on transportation
2. 75% of our product revenue achieved with Green Premium
3. 10% energy consumption savings
Carbon
Products & Solutions
Energy
Green Growth
Access to Energy
Suppliers
Rating
Workplace
Safety
Engagement
Diversity
Training
Access to Energy
Communities
Profit
4.
7 points growth revenue with “EcoXperts” partners above total growth revenue
5. 1 million households at the Base of the Pyramid have access to energy
6. 90% of our recommended suppliers embrace ISO 26000 guidelines
7. 3 major ethical stock market indices choose Schneider Electric
8. 300 sites recognized “Great place to work - Cool sites”
People
9. 30% reduction in the “Medical Incident Rate” (MIR)
10. 63% result in our “Employee Engagement Index”
11. 30% women in our talent pool (~ 2,500 people)
12. 1 day of training for each employee every year
13. 30,000 people at the BoP trained in energy management
14. 300 missions with the “Schneider Electric Teachers” NGO
Overall performance of the Barometer (score out of 10)
Stakes Progress plans and targets at year-end 2014 2013 2011
3,00
-
63%
-
-
-
-
23%
-
-
-
-
-
3
-
The 2011 performance serves as a starting value for the Planet & Society barometer of the Connect company program between 2012 and 2014.
2013 audited indicators.
The arrow shows if the indicator has risen, stayed the same or fallen compared to the previous year. The color shows if the indicator is above or below the objective of 8/10.
7.51
16.7%
68.7%
8%
1.28 pts
-47%
60%
28%
67%
32,602
228
695,685
18.8%
3
224
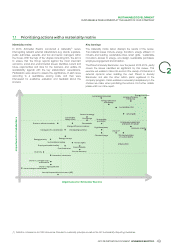
Priority objectives in response to sustainable
To have a significant impact and initiate lasting change, a
performance measure is required. That is why Schneider Electric
development challenges
has defined specific objectives and measures its results each
Schneider Electric has used the Planet & Society Barometer as its quarter using the Planet&Society Barometer. The Group
sustainable development dashboard since 2005. The Barometer undertakes corrective actions if necessary. These actions are
outlines the Group's sustainable development objectives for a carried out on an international scale.
three-year period and quarterly results for our key performance For example, the action plans target the lower, optimized energy
indicators. consumption, committing Schneider Electric, for itself and its
There are no recognized standards that define an organization’s customers, to significantly improving the energy efficiency of
sustainable development performance. The Planet&Society production processes, infrastructure and generally to reducing the
Barometer is Schneider Electric’s response to this matter. It allows environmental footprint, particularly CO2 equivalent emissions
us to meet our sustainability challenges and advance the Group on caused by the Group’s industrial and human activity.
the three pillars (Planet, Profit and People). The Barometer uses a
Operation and monitoring of
scoring scale of 10 and provides an overall measure of Group
improvement in sustainable development.
thePlanet&Society Barometer
The aim of the Planet&Society Barometer is to:
The Planet&Society Barometer 2012-2014 is part of the Connect
mobilize the corporate community around sustainable
l
company program. It comprises 14 key performance indicators
development objectives; scored out of 10. These 14 indicators replace the 13 objectives for
share the Group’s improvement plans with stakeholders.
l
the 2009-2011 period. The average of the scores, with each
Schneider Electric has permanently integrated objectives into its indicator weighted equally, provides the global performance of the
strategy to improve its economic, social and environmental Barometer. Departments directly affected by the improvement
performance and set up indicators to objectively measure progress plans (Human Resources, Environment, Access to Energy,etc.),
made and what is still to be done. On a daily basis, the Group each represented by a project leader, implement measures to
seeks to prove that economic, environmental, societal and social
interests are convergent.
50 2013 REGISTRATION DOCUMENT SCHNEIDER ELECTRIC