APC 2013 Annual Report Download - page 122
Download and view the complete annual report
Please find page 122 of the 2013 APC annual report below. You can navigate through the pages in the report by either clicking on the pages listed below, or by using the keyword search tool below to find specific information within the annual report.-
 1
1 -
2
-
3
-
4
-
5
-
6
-
7
-
8
-
9
-
10
-
11
-
12
-
13
-
14
-
15
-
16
-
17
-
18
-
19
-
20
-
21
-
22
-
23
-
24
-
25
-
26
-
27
-
28
-
29
-
30
-
31
-
32
-
33
-
34
-
35
-
36
-
37
-
38
-
39
-
40
-
41
-
42
-
43
-
44
-
45
-
46
-
47
-
48
-
49
-
50
-
51
-
52
-
53
-
54
-
55
-
56
-
57
-
58
-
59
-
60
-
61
-
62
-
63
-
64
-
65
-
66
-
67
-
68
-
69
-
70
-
71
-
72
-
73
-
74
-
75
-
76
-
77
-
78
-
79
-
80
-
81
-
82
-
83
-
84
-
85
-
86
-
87
-
88
-
89
-
90
-
91
-
92
-
93
-
94
-
95
-
96
-
97
-
98
-
99
-
100
-
101
-
102
-
103
-
104
-
105
-
106
-
107
-
108
-
109
-
110
-
111
-
 112
112 -
 113
113 -
 114
114 -
 115
115 -
 116
116 -
 117
117 -
 118
118 -
 119
119 -
 120
120 -
 121
121 -
 122
122 -
 123
123 -
 124
124 -
 125
125 -
 126
126 -
 127
127 -
 128
128 -
 129
129 -
 130
130 -
 131
131 -
 132
132 -
133
-
134
-
135
-
136
-
137
-
138
-
139
-
140
-
141
-
142
-
143
-
144
-
145
-
146
-
147
-
148
-
149
-
150
-
151
-
152
-
153
-
154
-
155
-
156
-
157
-
158
-
159
-
160
-
161
-
162
-
163
-
164
-
165
-
166
-
167
-
168
-
169
-
170
-
171
-
172
-
173
-
174
-
175
-
176
-
177
-
178
-
179
-
180
-
181
-
182
-
183
-
184
-
185
-
186
-
187
-
188
-
189
-
190
-
191
-
192
-
193
-
194
-
195
-
196
-
197
-
198
-
199
-
200
-
201
-
202
-
203
-
204
-
205
-
206
-
207
-
208
-
209
-
210
-
211
-
212
-
213
-
214
-
215
-
216
-
217
-
218
-
219
-
220
-
221
-
222
-
223
-
224
-
225
-
226
-
227
-
228
-
229
-
230
-
231
-
232
-
233
-
234
-
235
-
236
-
237
-
238
-
239
-
240
-
241
-
242
-
243
-
244
-
245
-
246
-
247
-
248
-
249
-
250
-
251
-
252
-
253
-
254
-
255
-
256
-
257
-
258
-
259
-
260
-
261
-
262
-
263
-
264
-
265
-
266
-
267
-
268
-
269
-
270
-
271
-
272
-
273
-
274
-
275
-
276
-
277
-
278
-
279
-
280
-
281
-
282
-
283
-
284
-
285
-
286
-
287
-
288
-
289
-
290
-
291
-
292
-
293
-
294
-
295
-
296
-
297
-
298
-
299
-
300
-
301
-
302
-
303
-
304
-
305
-
306
-
307
-
308
-
309
-
310
-
311
-
312
-
313
-
314
-
315
-
316
-
317
-
318
-
319
-
320
-
321
-
322
-
323
-
324
-
325
-
326
-
327
-
328
-
329
-
330
-
331
-
332
 |
 |

2SUSTAINABLE DEVELOPMENT
INDICATORS
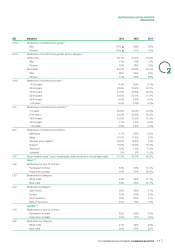
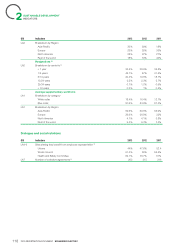
GRI Indicators 2013 2012 2011
LA10 Breakdown of costs by training type(2)
Health, safety and environment 12.7% 7.9% 10.4%
Technical 16.6% 27.8% 29.4%
Languages 17.9% 16% UA
IT 5.3% 1.5% UA
Solutions 6.5% 5.1% UA
Management and Leadership 22.6% 24.2% 18.8%
Others 14.2% 17.5% 25.6%
LA10 Breakdown of costs by category(2)
White collar 76.1% 73% 75.5%
Blue collar 23.9% 27% 24.5%
LA12 Employees having had a performance interview(3) 59.5% 66.3% 52%
Employees having had a career interview(3) 68% 31% 31.3%
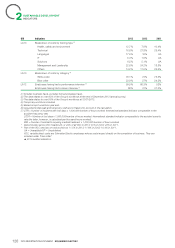
Includes business travel, excludes home/workplace travel.(1)
The data relates to over 83% of the Group’s workforce at the end of December 2013 (annual survey).(2)
The data relates to over 90% of the Group’s workforce at 12/31/2013.(3)
Temporary workforce included.(4)
Based on spot workforce year end.(5)
Acquisitions/disposals and temporary staff are not taken into account in the calculation.(6)
LTIR = Number of incidents with lost days x 1,000,000/number of hours worked. International standard indicator comparable to the (7)
accident frequency rate.
LTDR = Number of lost days x 1,000,000/number of hours worked. International standard indicator comparable to the accident severity
rate (the latter, however, is calculated per thousand hours worked).
MIR = Number of accidents requiring medical treatment x 1,000,000/number of hours worked.
Data includes service VDC headcount, or 24% of all VDC in 2013; 33% in 2012; 23% in 2011.*
Part of the VDC services on total workforce: 11.5% in 2013; 11.8% in 2012; 10.4% in 2011.**
UA = Unavailable/UP = Unpublished.
VDC, variable direct costs are Schneider Electric employees whose costs impact directly on the completion of business. They are
included under “blue collar”.
▲ 2013 audited indicators.
120 2013 REGISTRATION DOCUMENT SCHNEIDER ELECTRIC