APC 2013 Annual Report Download - page 179
Download and view the complete annual report
Please find page 179 of the 2013 APC annual report below. You can navigate through the pages in the report by either clicking on the pages listed below, or by using the keyword search tool below to find specific information within the annual report.-
 1
1 -
2
-
3
-
4
-
5
-
6
-
7
-
8
-
9
-
10
-
11
-
12
-
13
-
14
-
15
-
16
-
17
-
18
-
19
-
20
-
21
-
22
-
23
-
24
-
25
-
26
-
27
-
28
-
29
-
30
-
31
-
32
-
33
-
34
-
35
-
36
-
37
-
38
-
39
-
40
-
41
-
42
-
43
-
44
-
45
-
46
-
47
-
48
-
49
-
50
-
51
-
52
-
53
-
54
-
55
-
56
-
57
-
58
-
59
-
60
-
61
-
62
-
63
-
64
-
65
-
66
-
67
-
68
-
69
-
70
-
71
-
72
-
73
-
74
-
75
-
76
-
77
-
78
-
79
-
80
-
81
-
82
-
83
-
84
-
85
-
86
-
87
-
88
-
89
-
90
-
91
-
92
-
93
-
94
-
95
-
96
-
97
-
98
-
99
-
100
-
101
-
102
-
103
-
104
-
105
-
106
-
107
-
108
-
109
-
110
-
111
-
112
-
113
-
114
-
115
-
116
-
117
-
118
-
119
-
120
-
121
-
122
-
123
-
124
-
125
-
126
-
127
-
128
-
129
-
130
-
131
-
132
-
133
-
134
-
135
-
136
-
137
-
138
-
139
-
140
-
141
-
142
-
143
-
144
-
145
-
146
-
147
-
148
-
149
-
150
-
151
-
152
-
153
-
154
-
155
-
156
-
157
-
158
-
159
-
160
-
161
-
162
-
163
-
164
-
165
-
166
-
167
-
168
-
 169
169 -
 170
170 -
 171
171 -
 172
172 -
 173
173 -
 174
174 -
 175
175 -
 176
176 -
 177
177 -
 178
178 -
 179
179 -
 180
180 -
 181
181 -
 182
182 -
 183
183 -
 184
184 -
 185
185 -
 186
186 -
 187
187 -
 188
188 -
 189
189 -
190
-
191
-
192
-
193
-
194
-
195
-
196
-
197
-
198
-
199
-
200
-
201
-
202
-
203
-
204
-
205
-
206
-
207
-
208
-
209
-
210
-
211
-
212
-
213
-
214
-
215
-
216
-
217
-
218
-
219
-
220
-
221
-
222
-
223
-
224
-
225
-
226
-
227
-
228
-
229
-
230
-
231
-
232
-
233
-
234
-
235
-
236
-
237
-
238
-
239
-
240
-
241
-
242
-
243
-
244
-
245
-
246
-
247
-
248
-
249
-
250
-
251
-
252
-
253
-
254
-
255
-
256
-
257
-
258
-
259
-
260
-
261
-
262
-
263
-
264
-
265
-
266
-
267
-
268
-
269
-
270
-
271
-
272
-
273
-
274
-
275
-
276
-
277
-
278
-
279
-
280
-
281
-
282
-
283
-
284
-
285
-
286
-
287
-
288
-
289
-
290
-
291
-
292
-
293
-
294
-
295
-
296
-
297
-
298
-
299
-
300
-
301
-
302
-
303
-
304
-
305
-
306
-
307
-
308
-
309
-
310
-
311
-
312
-
313
-
314
-
315
-
316
-
317
-
318
-
319
-
320
-
321
-
322
-
323
-
324
-
325
-
326
-
327
-
328
-
329
-
330
-
331
-
332
 |
 |

BUSINESS REVIEW
REVIEW OF THE CONSOLIDATED FINANCIAL STATEMENTS
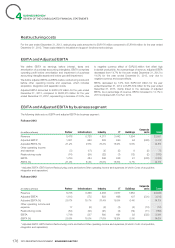
Partner business recorded an adjusted EBITA margin of 21.2% IT business reported an adjusted EBITA margin of 18.9% for the
for the year ended December31, 2013, up 0.5% compared year ended December31, 2013, down 0.1% in line with 19.0%
to20.7% for the year ended December31, 2012, due to good margin for the year ended December31, 2012, at all time high
industrial productivity. level.
Infrastructure business recorded an adjusted EBITA margin of Buildings business recorded an adjusted EBITA margin of 5.9%
9.8% for the year ended December31, 2013, down 0.9% for the year ended December31, 2013, down 0.5% compared to
compared to 10.7% for the year ended December31, 2012, 6.4% for the year ended December31, 2012, due to low volume
impacted by one-off charges from delays in project execution and in mature markets in the first half and unfavorable mix.
difficulties in public transportation business in Spain. Corporate costs amounted to EUR526million for the year ended
Industry business recorded an adjusted EBITA margin of 19.3% December31, 2013 or 2.2% of Group revenues, a similar level as
for the year ended December31, 2013, up 0.9% compared to in the year ended December31, 2012 (2.1% of Group revenues
18.4% for the year ended December31, 2012, thanks to positive or EUR501million).
pricing and good control of commercial costs.
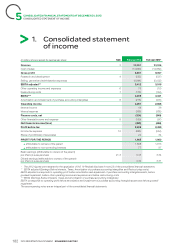
Operating income (EBIT)
Operating income (EBIT) increased from EUR2,866million for the item, amortization of intangibles linked to business combinations
year ended December31, 2012 to 3,091million for the year ended decreased by EUR6million (EUR218million on the year ended
December31, 2013, representing an increase of 7.9% linked to December31, 2013 compared to EUR224million on the year
the non-recurrence of a goodwill impairment on Buildings CGU of ended December31, 2012).
EUR250million (before tax effect) recorded in 2012. Excluding this
Net financial income/loss
4
Net financial loss amounted to EUR483million for the year ended to a lower average interest rate. The higher net financial loss is
December31, 2013, compared to EUR446million for the year mainly linked to the change in other financial incomes and costs,
ended December31, 2012 (restated for the application of IAS19 from a net expense of EUR97million for year ended December31,
Revised disclosed in note1.2 of the consolidated financial 2012 to a net expense of EUR159million for year ended
statements). Within the net financial loss, the cost of net financial December31, 2013. This is mainly due to a EUR50million
debt decreased from EUR349million for year ended December31, impairment of NVC Lighting investment described in note15 of the
2012 to EUR324million for year ended December31, 2013 thanks consolidated financial statements.
Tax
The effective tax rate was 25.5% for the year ended December31, investment that triggered no tax effect, the effective tax rate was
2013, increasing compared to 22.9% for the year ended limited to 25.0%. The corresponding tax expense increased from
December31, 2012 (restated for the application of IAS19 Revised EUR554million for the year ended December31, 2012 to
disclosed in note1.2 of the consolidated financial statements). EUR665million for the year ended December31, 2013.
However, excluding the EUR50million one-off impairment of NVC
Share of profit/(losses) of associates
The share of profit of associates amounted to EUR22million for the Schneider Electric consolidated financial statements and thus has
year ended December31, 2013, compared to EUR34million for not contributed anymore to share of profit of associates whereas
the year ended December31, 2012. From April1, 2013, she was contributing on a 12 months basis in 2012 when it was
Electroshield – TM Samara in Russia is fully consolidated in consolidated through equity method.
Non-controlling interests
Minority interests in net income for the year ended December31, 2013 totaled EUR77million, compared to EUR87million for the year
ended December31, 2012. This represented the share in net income attributable, in large part, to the minority interests of certain Chinese
companies.
177
2013 REGISTRATION DOCUMENT SCHNEIDER ELECTRIC