APC 2013 Annual Report Download - page 123
Download and view the complete annual report
Please find page 123 of the 2013 APC annual report below. You can navigate through the pages in the report by either clicking on the pages listed below, or by using the keyword search tool below to find specific information within the annual report.-
 1
1 -
2
-
3
-
4
-
5
-
6
-
7
-
8
-
9
-
10
-
11
-
12
-
13
-
14
-
15
-
16
-
17
-
18
-
19
-
20
-
21
-
22
-
23
-
24
-
25
-
26
-
27
-
28
-
29
-
30
-
31
-
32
-
33
-
34
-
35
-
36
-
37
-
38
-
39
-
40
-
41
-
42
-
43
-
44
-
45
-
46
-
47
-
48
-
49
-
50
-
51
-
52
-
53
-
54
-
55
-
56
-
57
-
58
-
59
-
60
-
61
-
62
-
63
-
64
-
65
-
66
-
67
-
68
-
69
-
70
-
71
-
72
-
73
-
74
-
75
-
76
-
77
-
78
-
79
-
80
-
81
-
82
-
83
-
84
-
85
-
86
-
87
-
88
-
89
-
90
-
91
-
92
-
93
-
94
-
95
-
96
-
97
-
98
-
99
-
100
-
101
-
102
-
103
-
104
-
105
-
106
-
107
-
108
-
109
-
110
-
111
-
112
-
 113
113 -
 114
114 -
 115
115 -
 116
116 -
 117
117 -
 118
118 -
 119
119 -
 120
120 -
 121
121 -
 122
122 -
 123
123 -
 124
124 -
 125
125 -
 126
126 -
 127
127 -
 128
128 -
 129
129 -
 130
130 -
 131
131 -
 132
132 -
 133
133 -
134
-
135
-
136
-
137
-
138
-
139
-
140
-
141
-
142
-
143
-
144
-
145
-
146
-
147
-
148
-
149
-
150
-
151
-
152
-
153
-
154
-
155
-
156
-
157
-
158
-
159
-
160
-
161
-
162
-
163
-
164
-
165
-
166
-
167
-
168
-
169
-
170
-
171
-
172
-
173
-
174
-
175
-
176
-
177
-
178
-
179
-
180
-
181
-
182
-
183
-
184
-
185
-
186
-
187
-
188
-
189
-
190
-
191
-
192
-
193
-
194
-
195
-
196
-
197
-
198
-
199
-
200
-
201
-
202
-
203
-
204
-
205
-
206
-
207
-
208
-
209
-
210
-
211
-
212
-
213
-
214
-
215
-
216
-
217
-
218
-
219
-
220
-
221
-
222
-
223
-
224
-
225
-
226
-
227
-
228
-
229
-
230
-
231
-
232
-
233
-
234
-
235
-
236
-
237
-
238
-
239
-
240
-
241
-
242
-
243
-
244
-
245
-
246
-
247
-
248
-
249
-
250
-
251
-
252
-
253
-
254
-
255
-
256
-
257
-
258
-
259
-
260
-
261
-
262
-
263
-
264
-
265
-
266
-
267
-
268
-
269
-
270
-
271
-
272
-
273
-
274
-
275
-
276
-
277
-
278
-
279
-
280
-
281
-
282
-
283
-
284
-
285
-
286
-
287
-
288
-
289
-
290
-
291
-
292
-
293
-
294
-
295
-
296
-
297
-
298
-
299
-
300
-
301
-
302
-
303
-
304
-
305
-
306
-
307
-
308
-
309
-
310
-
311
-
312
-
313
-
314
-
315
-
316
-
317
-
318
-
319
-
320
-
321
-
322
-
323
-
324
-
325
-
326
-
327
-
328
-
329
-
330
-
331
-
332
 |
 |

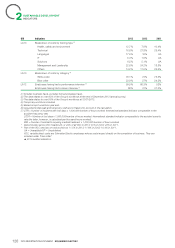
SUSTAINABLE DEVELOPMENT
INDICATORS
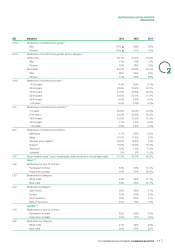
Societal indicators
7.3
The data below was consolidated for the first time in2010. It is With more than EUR10million in2013, the amount of contributions
distributed based on declarative information submitted by to the Foundation’s actions includes the Foundation’s intervention
Foundation delegates. budget, the amount of the donations from the entities, the
employees and the partners, and the amount of donations in kind.
It covers 80% of Schneider Electric employees and highlights the The number of employees involved in the Foundation’s actions is
importance of company and employee participation in the increasing from 35,741 in2012 to 38,633 in2013.
Foundation’s approach to involvement towards local communities.
2
Breakdown of the Foundation’s financial commitments
2013
FOUNDATION'S INTERVENTION BUDGET 4,000,000
Breakdown by program (in %)
Training and opportunities for young adults 70%
Fuel Poverty 10%
Raising awareness of sustainable development 5%
Employees’ volunteering/skills-based sponsorship 9%
Other (mainly involving employee/sponsorship expertise) 6%
Breakdown by region (in %)
Africa&Middle East 18%
America 12%
Asia 38%
Europe 32%
Breakdown of contributions from employees and Schneider Electric entities
totheFoundationactions
2013
TOTAL FINANCIAL CONTRIBUTION (IN EURO) 5,323,970
From employees 1,224,970
Of the Schneider Electric entity 3,843,732
From partners 255,268
Financial contribution per region (in %)
Africa&Middle East 3%
America 58%*
Asia 34%
Europe 5%
DONATIONS IN PRODUCTS OR SERVICES FOR A PARTNER/PROJECT OF THE FOUNDATION (in euro) 1,164,753
Number of employees involved in the Foundation’s actions 38,633
* Of which Square D/Schneider Electric North America
121
2013 REGISTRATION DOCUMENT SCHNEIDER ELECTRIC