APC 2013 Annual Report Download - page 186
Download and view the complete annual report
Please find page 186 of the 2013 APC annual report below. You can navigate through the pages in the report by either clicking on the pages listed below, or by using the keyword search tool below to find specific information within the annual report.-
 1
1 -
2
-
3
-
4
-
5
-
6
-
7
-
8
-
9
-
10
-
11
-
12
-
13
-
14
-
15
-
16
-
17
-
18
-
19
-
20
-
21
-
22
-
23
-
24
-
25
-
26
-
27
-
28
-
29
-
30
-
31
-
32
-
33
-
34
-
35
-
36
-
37
-
38
-
39
-
40
-
41
-
42
-
43
-
44
-
45
-
46
-
47
-
48
-
49
-
50
-
51
-
52
-
53
-
54
-
55
-
56
-
57
-
58
-
59
-
60
-
61
-
62
-
63
-
64
-
65
-
66
-
67
-
68
-
69
-
70
-
71
-
72
-
73
-
74
-
75
-
76
-
77
-
78
-
79
-
80
-
81
-
82
-
83
-
84
-
85
-
86
-
87
-
88
-
89
-
90
-
91
-
92
-
93
-
94
-
95
-
96
-
97
-
98
-
99
-
100
-
101
-
102
-
103
-
104
-
105
-
106
-
107
-
108
-
109
-
110
-
111
-
112
-
113
-
114
-
115
-
116
-
117
-
118
-
119
-
120
-
121
-
122
-
123
-
124
-
125
-
126
-
127
-
128
-
129
-
130
-
131
-
132
-
133
-
134
-
135
-
136
-
137
-
138
-
139
-
140
-
141
-
142
-
143
-
144
-
145
-
146
-
147
-
148
-
149
-
150
-
151
-
152
-
153
-
154
-
155
-
156
-
157
-
158
-
159
-
160
-
161
-
162
-
163
-
164
-
165
-
166
-
167
-
168
-
169
-
170
-
171
-
172
-
173
-
174
-
175
-
 176
176 -
 177
177 -
 178
178 -
 179
179 -
 180
180 -
 181
181 -
 182
182 -
 183
183 -
 184
184 -
 185
185 -
 186
186 -
 187
187 -
 188
188 -
 189
189 -
 190
190 -
 191
191 -
 192
192 -
 193
193 -
 194
194 -
 195
195 -
 196
196 -
197
-
198
-
199
-
200
-
201
-
202
-
203
-
204
-
205
-
206
-
207
-
208
-
209
-
210
-
211
-
212
-
213
-
214
-
215
-
216
-
217
-
218
-
219
-
220
-
221
-
222
-
223
-
224
-
225
-
226
-
227
-
228
-
229
-
230
-
231
-
232
-
233
-
234
-
235
-
236
-
237
-
238
-
239
-
240
-
241
-
242
-
243
-
244
-
245
-
246
-
247
-
248
-
249
-
250
-
251
-
252
-
253
-
254
-
255
-
256
-
257
-
258
-
259
-
260
-
261
-
262
-
263
-
264
-
265
-
266
-
267
-
268
-
269
-
270
-
271
-
272
-
273
-
274
-
275
-
276
-
277
-
278
-
279
-
280
-
281
-
282
-
283
-
284
-
285
-
286
-
287
-
288
-
289
-
290
-
291
-
292
-
293
-
294
-
295
-
296
-
297
-
298
-
299
-
300
-
301
-
302
-
303
-
304
-
305
-
306
-
307
-
308
-
309
-
310
-
311
-
312
-
313
-
314
-
315
-
316
-
317
-
318
-
319
-
320
-
321
-
322
-
323
-
324
-
325
-
326
-
327
-
328
-
329
-
330
-
331
-
332
 |
 |

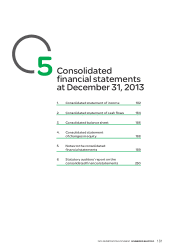
5CONSOLIDATED FINANCIALSTATEMENTS ATDECEMBER 31, 2013
CONSOLIDATED STATEMENT OF CASH FLOWS
Consolidated statement
2.
ofcashflows
(inmillions of euros) Note Full year 2013 Full year 2012*
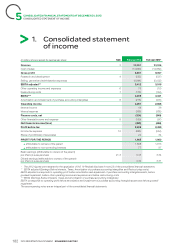
Profit for the year 1,965 1,900
Share of (profit)/losses of associates, net of dividends received (22) (34)
Adjustments to reconcile net profit to net cash flows provided by operating activities:
Depreciation of property, plant and equipment 13 408 394
Amortization of intangible assets other than goodwill 12 412 420
Impairment losses on non-current assets 5 51 241
Increase/(decrease) in provisions 23 (101) (36)
Losses/(gains) on disposals of fixed assets 2 (16)
Difference between tax paid and tax expense (110) (136)
Other non-cash adjustments 68 69
Net cash provided by operating activities 2,673 2,802before changes inoperatingassetsand liabilities
Decrease/(increase) in accounts receivable 53 (127)
Decrease/(increase) in inventories and work in process (23) 210
(Decrease)/increase in accounts payable 246 (5)
Change in other current assets and liabilities (48) (79)
Change in working capital requirement 228 (1)
Total I – Cash flows from operating activities 2,901 2,801
Purchases of property, plant and equipment 13 (473) (472)
Proceeds from disposals of property, plant and equipment 93 58
Purchases of intangible assets 12 (349) (315)
Proceeds from disposals of intangible assets 15 10
Net cash used by investment in operating assets (714) (719)
Net financial investments 2 (294) (242)
Proceeds from sale of financial assets - 121
Purchases of other long-term investments (116) (14)
Increase in long-term pension assets (65) (79)
Sub-total (475) (214)
Total II – Cash flows from/(used in) investing activities (1,189) (933)
Issuance of bonds 24 600 601
Repayment of bonds 24 (587) -
Sale/(purchase) of own shares 26 -
Increase/(reduction) in other financial debt 1,066 (585)
Proceeds from issuance of shares 209 221
Dividends paid: Schneider ElectricSA (1,025) (919)
Non-controlling interests (11) (72)
Total III – Cash flows from/(used in) financing activities 278 (754)
184 2013 REGISTRATION DOCUMENT SCHNEIDER ELECTRIC