APC 2013 Annual Report Download - page 116
Download and view the complete annual report
Please find page 116 of the 2013 APC annual report below. You can navigate through the pages in the report by either clicking on the pages listed below, or by using the keyword search tool below to find specific information within the annual report.-
 1
1 -
2
-
3
-
4
-
5
-
6
-
7
-
8
-
9
-
10
-
11
-
12
-
13
-
14
-
15
-
16
-
17
-
18
-
19
-
20
-
21
-
22
-
23
-
24
-
25
-
26
-
27
-
28
-
29
-
30
-
31
-
32
-
33
-
34
-
35
-
36
-
37
-
38
-
39
-
40
-
41
-
42
-
43
-
44
-
45
-
46
-
47
-
48
-
49
-
50
-
51
-
52
-
53
-
54
-
55
-
56
-
57
-
58
-
59
-
60
-
61
-
62
-
63
-
64
-
65
-
66
-
67
-
68
-
69
-
70
-
71
-
72
-
73
-
74
-
75
-
76
-
77
-
78
-
79
-
80
-
81
-
82
-
83
-
84
-
85
-
86
-
87
-
88
-
89
-
90
-
91
-
92
-
93
-
94
-
95
-
96
-
97
-
98
-
99
-
100
-
101
-
102
-
103
-
104
-
105
-
 106
106 -
 107
107 -
 108
108 -
 109
109 -
 110
110 -
 111
111 -
 112
112 -
 113
113 -
 114
114 -
 115
115 -
 116
116 -
 117
117 -
 118
118 -
 119
119 -
 120
120 -
 121
121 -
 122
122 -
 123
123 -
 124
124 -
 125
125 -
 126
126 -
127
-
128
-
129
-
130
-
131
-
132
-
133
-
134
-
135
-
136
-
137
-
138
-
139
-
140
-
141
-
142
-
143
-
144
-
145
-
146
-
147
-
148
-
149
-
150
-
151
-
152
-
153
-
154
-
155
-
156
-
157
-
158
-
159
-
160
-
161
-
162
-
163
-
164
-
165
-
166
-
167
-
168
-
169
-
170
-
171
-
172
-
173
-
174
-
175
-
176
-
177
-
178
-
179
-
180
-
181
-
182
-
183
-
184
-
185
-
186
-
187
-
188
-
189
-
190
-
191
-
192
-
193
-
194
-
195
-
196
-
197
-
198
-
199
-
200
-
201
-
202
-
203
-
204
-
205
-
206
-
207
-
208
-
209
-
210
-
211
-
212
-
213
-
214
-
215
-
216
-
217
-
218
-
219
-
220
-
221
-
222
-
223
-
224
-
225
-
226
-
227
-
228
-
229
-
230
-
231
-
232
-
233
-
234
-
235
-
236
-
237
-
238
-
239
-
240
-
241
-
242
-
243
-
244
-
245
-
246
-
247
-
248
-
249
-
250
-
251
-
252
-
253
-
254
-
255
-
256
-
257
-
258
-
259
-
260
-
261
-
262
-
263
-
264
-
265
-
266
-
267
-
268
-
269
-
270
-
271
-
272
-
273
-
274
-
275
-
276
-
277
-
278
-
279
-
280
-
281
-
282
-
283
-
284
-
285
-
286
-
287
-
288
-
289
-
290
-
291
-
292
-
293
-
294
-
295
-
296
-
297
-
298
-
299
-
300
-
301
-
302
-
303
-
304
-
305
-
306
-
307
-
308
-
309
-
310
-
311
-
312
-
313
-
314
-
315
-
316
-
317
-
318
-
319
-
320
-
321
-
322
-
323
-
324
-
325
-
326
-
327
-
328
-
329
-
330
-
331
-
332
 |
 |

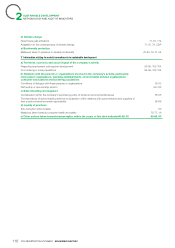
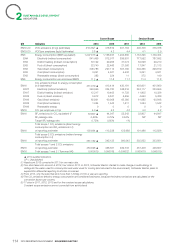
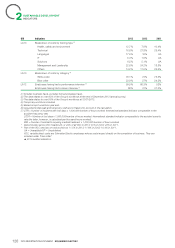
2SUSTAINABLE DEVELOPMENT
INDICATORS
Current Scope Constant Scope
GRI Indicators 2013 2012 2011 2013 2012
EN19-20 VOC emissions (in kg) (estimates) 415,3523 ▲416,612 451,154 405,706 375,378
EN19-20 VOC/per employee (kg/p) (estimates) 3.8 ▲4.2 4.4 4.1 3.9
EN3 Energy consumption (MWh equivalent) 1,207,613 ▲1,166,497 1,204,580 1,133,325 1,139,404
EN4 Electricity (indirect consumption) 841,495 812,917 839,991 777,552 787,592
EN4 District heating (indirect consumption) 33,122 29,255 31,074 32,098 29,210
EN3 Fuel oil (direct consumption) 22,740 22,466 21,366 17,847 21,113
EN3 Gas (direct consumption) 306,783 297,114 307,705 302,365 296,819
EN3 Coal (direct consumption) 3,091 4,521 4,432 3,091 4,521
EN3 Renewable energy (direct consumption) 382 224 11 372 149
EN5 Energy consumption per employee (MWh) 11.2 ▲11.8 11.7 11.4 11.8
CO2 emissions linked to energy consumption
EN16 431,019 ▲413,414 430,191 403,601 401,860(in t) (estimates)4
EN17 Electricity (indirect emission) 348,845 334,720 348,316 324,117 323,655
EN17 District heating (indirect emission) 12,317 10,403 11,728 11,805 10,326
EN16 Fuel oil (direct emission) 5,912 5,841 5,555 4,640 5,489
EN16 Gas (direct emission) 62,891 60,908 63,080 61,985 60,848
EN16 Coal (direct emission) 1,054 1,542 1,511 1,054 1,542
EN16 Renewable energy 0 0 0 0 0
EN16 CO2 per employee in t/p) 4.0 ▲4.2 4.2 4,0 4,2
EN16 SF6 emissions (in CO2 equivalent t)533,807 ▲44,947 52,542 33,807 44,947
SF6 leakage rate 0,56% 0.75% 0.94% NP NP
Target SF6 leakage rate 0.75% 0.95% 1% - -
Total scope 1 CO2 emissions (direct energy
consumption and SF6 emissions in t)
EN16 of reporting perimeter 103,664 ▲113,238 122,688 101,486 112,826
Total scope 2 CO2 emissions (indirect energy
consumption in t)
EN16 of reporting perimeter 361,162 ▲345,123 360,045 335,922 333,981
Total scopes 1 and 2 CO2 emissions
EN16 of reporting perimeter 464,826 ▲458,361 482,733 437,408 446,807
EN16 Total scopes 1 and 2 / Turnover (t/€) 0.000019 0.000019 0.000022 0.000019 0.000019
▲ 2013 audited indicators.
UP =Unpublished.
Headcount 2012 corrected in 2013 for one major site.(1)
Two sites taken into account in 2012, four sites in 2013. In2012, Schneider Electric started to make change in methodology to (2)
distinguish the water used for consumption and water used for cooling (and returned to the environment). Schneider Electric plans to
expand this differential reporting to all sites concerned.
From 2013, only the sites that emit more than 1,000kg of VOC a year are reporting.(3)
The CO2 emissions linked to energy consumption are considered estimates, because the indirect emissions are calculated on the (4)
conversion factors per country.
17sites in2011, 2012, 2013 and for the constant scope calculations.(5)
Constant scope emissions are not corrected from activity level.
114 2013 REGISTRATION DOCUMENT SCHNEIDER ELECTRIC