APC 2013 Annual Report Download - page 215
Download and view the complete annual report
Please find page 215 of the 2013 APC annual report below. You can navigate through the pages in the report by either clicking on the pages listed below, or by using the keyword search tool below to find specific information within the annual report.-
 1
1 -
2
-
3
-
4
-
5
-
6
-
7
-
8
-
9
-
10
-
11
-
12
-
13
-
14
-
15
-
16
-
17
-
18
-
19
-
20
-
21
-
22
-
23
-
24
-
25
-
26
-
27
-
28
-
29
-
30
-
31
-
32
-
33
-
34
-
35
-
36
-
37
-
38
-
39
-
40
-
41
-
42
-
43
-
44
-
45
-
46
-
47
-
48
-
49
-
50
-
51
-
52
-
53
-
54
-
55
-
56
-
57
-
58
-
59
-
60
-
61
-
62
-
63
-
64
-
65
-
66
-
67
-
68
-
69
-
70
-
71
-
72
-
73
-
74
-
75
-
76
-
77
-
78
-
79
-
80
-
81
-
82
-
83
-
84
-
85
-
86
-
87
-
88
-
89
-
90
-
91
-
92
-
93
-
94
-
95
-
96
-
97
-
98
-
99
-
100
-
101
-
102
-
103
-
104
-
105
-
106
-
107
-
108
-
109
-
110
-
111
-
112
-
113
-
114
-
115
-
116
-
117
-
118
-
119
-
120
-
121
-
122
-
123
-
124
-
125
-
126
-
127
-
128
-
129
-
130
-
131
-
132
-
133
-
134
-
135
-
136
-
137
-
138
-
139
-
140
-
141
-
142
-
143
-
144
-
145
-
146
-
147
-
148
-
149
-
150
-
151
-
152
-
153
-
154
-
155
-
156
-
157
-
158
-
159
-
160
-
161
-
162
-
163
-
164
-
165
-
166
-
167
-
168
-
169
-
170
-
171
-
172
-
173
-
174
-
175
-
176
-
177
-
178
-
179
-
180
-
181
-
182
-
183
-
184
-
185
-
186
-
187
-
188
-
189
-
190
-
191
-
192
-
193
-
194
-
195
-
196
-
197
-
198
-
199
-
200
-
201
-
202
-
203
-
204
-
 205
205 -
 206
206 -
 207
207 -
 208
208 -
 209
209 -
 210
210 -
 211
211 -
 212
212 -
 213
213 -
 214
214 -
 215
215 -
 216
216 -
 217
217 -
 218
218 -
 219
219 -
 220
220 -
 221
221 -
 222
222 -
 223
223 -
 224
224 -
 225
225 -
226
-
227
-
228
-
229
-
230
-
231
-
232
-
233
-
234
-
235
-
236
-
237
-
238
-
239
-
240
-
241
-
242
-
243
-
244
-
245
-
246
-
247
-
248
-
249
-
250
-
251
-
252
-
253
-
254
-
255
-
256
-
257
-
258
-
259
-
260
-
261
-
262
-
263
-
264
-
265
-
266
-
267
-
268
-
269
-
270
-
271
-
272
-
273
-
274
-
275
-
276
-
277
-
278
-
279
-
280
-
281
-
282
-
283
-
284
-
285
-
286
-
287
-
288
-
289
-
290
-
291
-
292
-
293
-
294
-
295
-
296
-
297
-
298
-
299
-
300
-
301
-
302
-
303
-
304
-
305
-
306
-
307
-
308
-
309
-
310
-
311
-
312
-
313
-
314
-
315
-
316
-
317
-
318
-
319
-
320
-
321
-
322
-
323
-
324
-
325
-
326
-
327
-
328
-
329
-
330
-
331
-
332
 |
 |

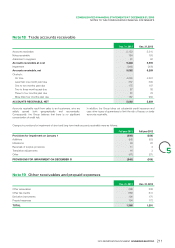
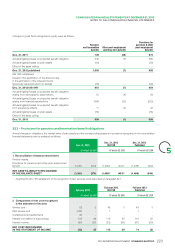
CONSOLIDATED FINANCIALSTATEMENTS ATDECEMBER 31, 2013
NOTES TO THE CONSOLIDATED FINANCIAL STATEMENTS
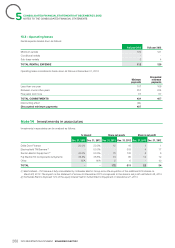
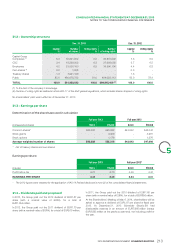
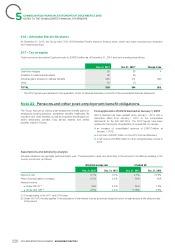
21.2 – Ownership structure
Dec.31, 2013 Dec.31, 2012
Capital Number Voting rights Number Capital Voting rights
% of shares % of voting rights %%
Capital Group 5.4 30,561,902 5.0 30,561,902 7.5 6.9Companies(1)
CDC 3.4 19,239,002 6.2 37,693,092 3.7 6.5
Employees 4.2 23,536,150 6.5 39,590,106 4.4 6.8
Own shares(2) 0.0 1,058 - - 0.0 -
Treasury shares 1.4 7,941,129 - - 1.5 -
Public 85.6 480,678,782 81.0 494,028,113 82.9 78.4
TOTAL 100.0 561,958,023 100.0 609,815,400(2) 100.0 100.0
To the best of the company’s knowledge.(1)
Number of voting rights as defined in article223-11 of the AMF general regulations, which includes shares stripped of voting rights.(2)
No shareholders’ pact was in effect as of December31, 2013.
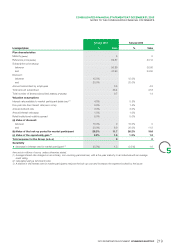
21.3 – Earnings per share
Determination of the share base used in calculation
Full year 2013 Full year 2012
(in thousands of shares) Basic Diluted Basic Diluted
Common shares* 550,682 550,682 543,042 543,042
Stock grants - 3,459 - 3,281
Stock options - 1,176 - 1,376
Average weighted number of shares 550,682 555,316 543,042 547,698
Net of treasury shares and own shares.* 5
Earnings per share
Full year 2013 Full year 2012*
(in euros) Basic Diluted Basic Diluted
Profit before tax 4.74 4.70 4.46 4.42
EARNINGS PER SHARE 3.43 3.40 3.34 3.31
The 2012 figures were restated for the application of IAS19 Revised disclosed in note22 of the consolidated financial statements.*
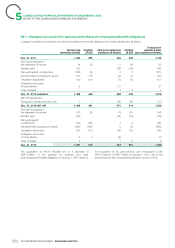
21.4 – Dividends paid and proposed
In2011, the Group paid out the 2010 dividend of EUR1.60 per
share (with a nominal value of EUR4), for a total of EUR856million.
In2013, the Group paid out the 2012 dividend of EUR1.87 per At the Shareholders’ Meeting of May6, 2014, shareholders will be
share (with a nominal value of EUR4), for a total of asked to approve a dividend of EUR1.87 per share forfiscal year
EUR1,054million. 2013. At December31, 2013 Schneider ElectricSA had
In2012, the Group paid out the 2011 dividend of EUR1.70 per distributable reserves in an amount of EUR7,965million (versus
share (with a nominal value of EUR4), for a total of EUR919million. EUR8,563million at the previous year-end), not including profit for
the year.
213
2013 REGISTRATION DOCUMENT SCHNEIDER ELECTRIC