APC 2013 Annual Report Download - page 226
Download and view the complete annual report
Please find page 226 of the 2013 APC annual report below. You can navigate through the pages in the report by either clicking on the pages listed below, or by using the keyword search tool below to find specific information within the annual report.-
 1
1 -
2
-
3
-
4
-
5
-
6
-
7
-
8
-
9
-
10
-
11
-
12
-
13
-
14
-
15
-
16
-
17
-
18
-
19
-
20
-
21
-
22
-
23
-
24
-
25
-
26
-
27
-
28
-
29
-
30
-
31
-
32
-
33
-
34
-
35
-
36
-
37
-
38
-
39
-
40
-
41
-
42
-
43
-
44
-
45
-
46
-
47
-
48
-
49
-
50
-
51
-
52
-
53
-
54
-
55
-
56
-
57
-
58
-
59
-
60
-
61
-
62
-
63
-
64
-
65
-
66
-
67
-
68
-
69
-
70
-
71
-
72
-
73
-
74
-
75
-
76
-
77
-
78
-
79
-
80
-
81
-
82
-
83
-
84
-
85
-
86
-
87
-
88
-
89
-
90
-
91
-
92
-
93
-
94
-
95
-
96
-
97
-
98
-
99
-
100
-
101
-
102
-
103
-
104
-
105
-
106
-
107
-
108
-
109
-
110
-
111
-
112
-
113
-
114
-
115
-
116
-
117
-
118
-
119
-
120
-
121
-
122
-
123
-
124
-
125
-
126
-
127
-
128
-
129
-
130
-
131
-
132
-
133
-
134
-
135
-
136
-
137
-
138
-
139
-
140
-
141
-
142
-
143
-
144
-
145
-
146
-
147
-
148
-
149
-
150
-
151
-
152
-
153
-
154
-
155
-
156
-
157
-
158
-
159
-
160
-
161
-
162
-
163
-
164
-
165
-
166
-
167
-
168
-
169
-
170
-
171
-
172
-
173
-
174
-
175
-
176
-
177
-
178
-
179
-
180
-
181
-
182
-
183
-
184
-
185
-
186
-
187
-
188
-
189
-
190
-
191
-
192
-
193
-
194
-
195
-
196
-
197
-
198
-
199
-
200
-
201
-
202
-
203
-
204
-
205
-
206
-
207
-
208
-
209
-
210
-
211
-
212
-
213
-
214
-
215
-
 216
216 -
 217
217 -
 218
218 -
 219
219 -
 220
220 -
 221
221 -
 222
222 -
 223
223 -
 224
224 -
 225
225 -
 226
226 -
 227
227 -
 228
228 -
 229
229 -
 230
230 -
 231
231 -
 232
232 -
 233
233 -
 234
234 -
 235
235 -
 236
236 -
237
-
238
-
239
-
240
-
241
-
242
-
243
-
244
-
245
-
246
-
247
-
248
-
249
-
250
-
251
-
252
-
253
-
254
-
255
-
256
-
257
-
258
-
259
-
260
-
261
-
262
-
263
-
264
-
265
-
266
-
267
-
268
-
269
-
270
-
271
-
272
-
273
-
274
-
275
-
276
-
277
-
278
-
279
-
280
-
281
-
282
-
283
-
284
-
285
-
286
-
287
-
288
-
289
-
290
-
291
-
292
-
293
-
294
-
295
-
296
-
297
-
298
-
299
-
300
-
301
-
302
-
303
-
304
-
305
-
306
-
307
-
308
-
309
-
310
-
311
-
312
-
313
-
314
-
315
-
316
-
317
-
318
-
319
-
320
-
321
-
322
-
323
-
324
-
325
-
326
-
327
-
328
-
329
-
330
-
331
-
332
 |
 |

5CONSOLIDATED FINANCIALSTATEMENTS ATDECEMBER 31, 2013
NOTES TO THE CONSOLIDATED FINANCIAL STATEMENTS
Full year 2013 Full year 2012
Of which SE USA Of which SE USA
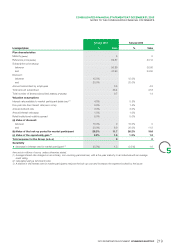
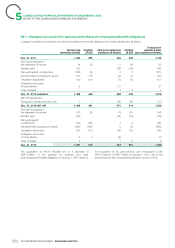
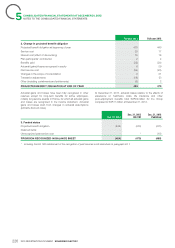
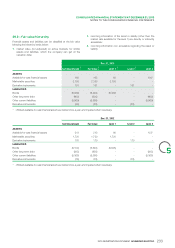
3. Change in projected benefit obligation
Projected benefit obligation at beginning of year 3,061 1,344 2,685 1,210
Service cost 52 348 3
Past service cost/Curtailments and Settlements (160) -1 -
Interest cost (effect of discounting) 103 49 116 55
Plan participants’ contributions 4-4 -
Benefits paid (126) (54) (119) (54)
Changes in the scope of consolidation 338 -
Actuarial (gains)/losses recognized in equity (188) (157) 340 157
Translation adjustments (95) (52) (17) (27)
Other 4 - (5) -
PROJECTED BENEFIT OBLIGATION AT END OF YEAR 2,658 1,136 3,061 1,344
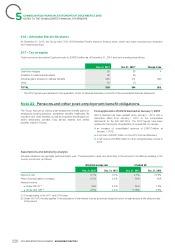
Plans changes occurred in France, Norway and United-Kingdom. EUR230million of losses at December31, 2012. At
December31, 2013, the gains resulting from changes in
Actuarial gains and losses have been fully recognized in other demographic assumptions on pension and termination benefit
reserves. They stem mainly from changes in financial actuarial obligations total EUR1million for the Group compared to
assumptions (primarily discount rates) used to measure EUR43million of losses at December31, 2012.
obligations in the United States, the United Kingdom and the euro
zone. At December31, 2013, actuarial losses relative to the effects of
experience on pension and termination benefit obligations total
At December31, 2013, actuarial gains resulting from changes in EUR11million for the Group compared to EUR67million at
financial assumptions on pension and termination benefit December31, 2012.
obligations total EUR198million for the Group compared to
Full year 2012 Full year 2012
Full year 2013 IAS19R Published
Of which SE USA Of which SE USA Of which SE USA
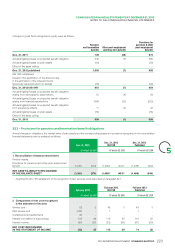
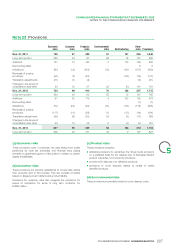
4. Change in fair value of plan assets
Fair value of plan assets at beginning of year 1,572 853 1,421 814 1,421 814
Interest income 50 27 52* 29* 91 60
Plan participants’ contribution 4-4 -4 -
Employer contributions 64 35 103 9 103 9
Benefits paid (82) (54) (86) (54) (86) (54)
Actuarial gains/(losses) recognized in equity 74 39 88 72 49 41
Changes in the scope of consolidation --2 -2 -
Translation adjustments (63) (38) (7) (17) (7) (17)
Curtailments and settlements (22) -----
Other - - (5) - (5) -
FAIR VALUE OF PLAN ASSETS AT END OF YEAR 1,597 862 1,572 853 1,572 853
Including the IAS19R impact of the change in rate in the calculation on the interest income (expected return on assets), calculated under *
IAS19R with the discount rate of the period.
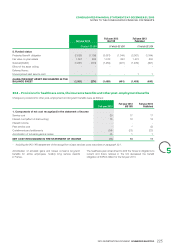
For comparison, the net cost recognized in the statement of At December31, 2013, the actual return on plan assets was
income increased by EUR39million for the full year 2012 under EUR124million compared with EUR140million at December31,
IAS19R due to the use of discount rates in the calculation of 2012.
expected return on assets. Actuarial gains and losses have been fully recognized in other
reserves.
224 2013 REGISTRATION DOCUMENT SCHNEIDER ELECTRIC