APC 2013 Annual Report Download - page 201
Download and view the complete annual report
Please find page 201 of the 2013 APC annual report below. You can navigate through the pages in the report by either clicking on the pages listed below, or by using the keyword search tool below to find specific information within the annual report.-
 1
1 -
2
-
3
-
4
-
5
-
6
-
7
-
8
-
9
-
10
-
11
-
12
-
13
-
14
-
15
-
16
-
17
-
18
-
19
-
20
-
21
-
22
-
23
-
24
-
25
-
26
-
27
-
28
-
29
-
30
-
31
-
32
-
33
-
34
-
35
-
36
-
37
-
38
-
39
-
40
-
41
-
42
-
43
-
44
-
45
-
46
-
47
-
48
-
49
-
50
-
51
-
52
-
53
-
54
-
55
-
56
-
57
-
58
-
59
-
60
-
61
-
62
-
63
-
64
-
65
-
66
-
67
-
68
-
69
-
70
-
71
-
72
-
73
-
74
-
75
-
76
-
77
-
78
-
79
-
80
-
81
-
82
-
83
-
84
-
85
-
86
-
87
-
88
-
89
-
90
-
91
-
92
-
93
-
94
-
95
-
96
-
97
-
98
-
99
-
100
-
101
-
102
-
103
-
104
-
105
-
106
-
107
-
108
-
109
-
110
-
111
-
112
-
113
-
114
-
115
-
116
-
117
-
118
-
119
-
120
-
121
-
122
-
123
-
124
-
125
-
126
-
127
-
128
-
129
-
130
-
131
-
132
-
133
-
134
-
135
-
136
-
137
-
138
-
139
-
140
-
141
-
142
-
143
-
144
-
145
-
146
-
147
-
148
-
149
-
150
-
151
-
152
-
153
-
154
-
155
-
156
-
157
-
158
-
159
-
160
-
161
-
162
-
163
-
164
-
165
-
166
-
167
-
168
-
169
-
170
-
171
-
172
-
173
-
174
-
175
-
176
-
177
-
178
-
179
-
180
-
181
-
182
-
183
-
184
-
185
-
186
-
187
-
188
-
189
-
190
-
 191
191 -
 192
192 -
 193
193 -
 194
194 -
 195
195 -
 196
196 -
 197
197 -
 198
198 -
 199
199 -
 200
200 -
 201
201 -
 202
202 -
 203
203 -
 204
204 -
 205
205 -
 206
206 -
 207
207 -
 208
208 -
 209
209 -
 210
210 -
 211
211 -
212
-
213
-
214
-
215
-
216
-
217
-
218
-
219
-
220
-
221
-
222
-
223
-
224
-
225
-
226
-
227
-
228
-
229
-
230
-
231
-
232
-
233
-
234
-
235
-
236
-
237
-
238
-
239
-
240
-
241
-
242
-
243
-
244
-
245
-
246
-
247
-
248
-
249
-
250
-
251
-
252
-
253
-
254
-
255
-
256
-
257
-
258
-
259
-
260
-
261
-
262
-
263
-
264
-
265
-
266
-
267
-
268
-
269
-
270
-
271
-
272
-
273
-
274
-
275
-
276
-
277
-
278
-
279
-
280
-
281
-
282
-
283
-
284
-
285
-
286
-
287
-
288
-
289
-
290
-
291
-
292
-
293
-
294
-
295
-
296
-
297
-
298
-
299
-
300
-
301
-
302
-
303
-
304
-
305
-
306
-
307
-
308
-
309
-
310
-
311
-
312
-
313
-
314
-
315
-
316
-
317
-
318
-
319
-
320
-
321
-
322
-
323
-
324
-
325
-
326
-
327
-
328
-
329
-
330
-
331
-
332
 |
 |

CONSOLIDATED FINANCIALSTATEMENTS ATDECEMBER 31, 2013
NOTES TO THE CONSOLIDATED FINANCIAL STATEMENTS
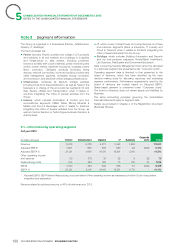
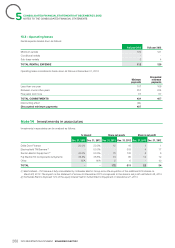
Full year 2012
Corporate
(inmillions of euros) Partner Infrastructure Industry IT Buildings Totalcosts
Revenue 8,738 5,366 4,483 3,677 1,682 - 23,946
Adjusted EBITA* 1,813 575 823 698 107 (501) 3,515
Adjusted EBITA % 20.7% 10.7% 18.4% 19.0% 6.4% - 14.7%
Other operating income
17 (6) (2) (3) (3) (13) (10)andexpense
Restructuring costs (84) (32) (21) (4) (12) (11) (164)
EBITA 1,746 537 800 691 92 (525) 3,341
EBITA % 20.0% 10.0% 17.8% 18.8% 5.5% - 14.0%
Adjusted EBITA: EBITA before Restructuring costs and before Other operating income and expenses (of which Costs of acquisition, *
integration and separation).
Revenue related to solutions amounts to 39% of total revenue in2012.
Information by region3.2 –
The geographic regions covered by the Group are:
Western Europe;
l
North America: United States, Canada and Mexico;
l
Asia-Pacific;
l
Rest of the World (Eastern Europe, Middle East, Africa, South America).
l
Non-current assets include net goodwill, net intangible assets and net property, plant and equipment.
Dec.31, 2013
Western of which North of which Asia- of which Rest of the
TotalEurope France America USA Pacific China world
Revenue by country market 6,629 1,701 5,898 4,857 6,459 3,068 4,565 23,551
Non-current assets 8,095 1,851 6,311 6,091 3,970 1,175 1,356 19,732 5
Dec.31, 2012
Western of which North of which Asia- of which Rest of the
TotalEurope France America USA Pacific China world
Revenue by country market 7,073 1,822 5,949 4,966 6,507 3,036 4,417 23,946
Non-current assets 8,194 1,801 6,591 6,404 4,389 1,205 871 20,045
Moreover, the Group follows the share of new economies in revenue:
Full year 2013 Full year 2012 Full year 2011
Revenue – Mature countries 13,429 57% 14,186 59% 13,512 60%
Revenue – New economies 10,122 43% 9,760 41% 8,833 40%
TOTAL 23,551 100% 23,946 100% 22,345 100%
3.3 – Degree of dependence in relation to main customers
No single customer accounts for more than 10% of consolidated revenue.
199
2013 REGISTRATION DOCUMENT SCHNEIDER ELECTRIC