APC 2013 Annual Report Download - page 73
Download and view the complete annual report
Please find page 73 of the 2013 APC annual report below. You can navigate through the pages in the report by either clicking on the pages listed below, or by using the keyword search tool below to find specific information within the annual report.-
 1
1 -
2
-
3
-
4
-
5
-
6
-
7
-
8
-
9
-
10
-
11
-
12
-
13
-
14
-
15
-
16
-
17
-
18
-
19
-
20
-
21
-
22
-
23
-
24
-
25
-
26
-
27
-
28
-
29
-
30
-
31
-
32
-
33
-
34
-
35
-
36
-
37
-
38
-
39
-
40
-
41
-
42
-
43
-
44
-
45
-
46
-
47
-
48
-
49
-
50
-
51
-
52
-
53
-
54
-
55
-
56
-
57
-
58
-
59
-
60
-
61
-
62
-
 63
63 -
 64
64 -
 65
65 -
 66
66 -
 67
67 -
 68
68 -
 69
69 -
 70
70 -
 71
71 -
 72
72 -
 73
73 -
 74
74 -
 75
75 -
 76
76 -
 77
77 -
 78
78 -
 79
79 -
 80
80 -
 81
81 -
 82
82 -
 83
83 -
84
-
85
-
86
-
87
-
88
-
89
-
90
-
91
-
92
-
93
-
94
-
95
-
96
-
97
-
98
-
99
-
100
-
101
-
102
-
103
-
104
-
105
-
106
-
107
-
108
-
109
-
110
-
111
-
112
-
113
-
114
-
115
-
116
-
117
-
118
-
119
-
120
-
121
-
122
-
123
-
124
-
125
-
126
-
127
-
128
-
129
-
130
-
131
-
132
-
133
-
134
-
135
-
136
-
137
-
138
-
139
-
140
-
141
-
142
-
143
-
144
-
145
-
146
-
147
-
148
-
149
-
150
-
151
-
152
-
153
-
154
-
155
-
156
-
157
-
158
-
159
-
160
-
161
-
162
-
163
-
164
-
165
-
166
-
167
-
168
-
169
-
170
-
171
-
172
-
173
-
174
-
175
-
176
-
177
-
178
-
179
-
180
-
181
-
182
-
183
-
184
-
185
-
186
-
187
-
188
-
189
-
190
-
191
-
192
-
193
-
194
-
195
-
196
-
197
-
198
-
199
-
200
-
201
-
202
-
203
-
204
-
205
-
206
-
207
-
208
-
209
-
210
-
211
-
212
-
213
-
214
-
215
-
216
-
217
-
218
-
219
-
220
-
221
-
222
-
223
-
224
-
225
-
226
-
227
-
228
-
229
-
230
-
231
-
232
-
233
-
234
-
235
-
236
-
237
-
238
-
239
-
240
-
241
-
242
-
243
-
244
-
245
-
246
-
247
-
248
-
249
-
250
-
251
-
252
-
253
-
254
-
255
-
256
-
257
-
258
-
259
-
260
-
261
-
262
-
263
-
264
-
265
-
266
-
267
-
268
-
269
-
270
-
271
-
272
-
273
-
274
-
275
-
276
-
277
-
278
-
279
-
280
-
281
-
282
-
283
-
284
-
285
-
286
-
287
-
288
-
289
-
290
-
291
-
292
-
293
-
294
-
295
-
296
-
297
-
298
-
299
-
300
-
301
-
302
-
303
-
304
-
305
-
306
-
307
-
308
-
309
-
310
-
311
-
312
-
313
-
314
-
315
-
316
-
317
-
318
-
319
-
320
-
321
-
322
-
323
-
324
-
325
-
326
-
327
-
328
-
329
-
330
-
331
-
332
 |
 |

SUSTAINABLE DEVELOPMENT
SCHNEIDER ELECTRIC’S COMMITMENT TO ENVIRONMENTAL PERFORMANCE
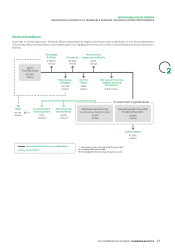
Organization
In 2013, the organization within Global Supply Chain evolved from
three regions to the following regions: EMEA (Europe – Middle
At the corporate level, the Sustainable Development Department East – Africa), North America, South America, India, China, EAJP
establishes the Group’s sustainability strategy and leads the (East Asia – Japan – Pacific). For each region, a Safety &
corporate environmental players, jointly with the Global Supply Environment VP has been appointed. Each one is responsible for
Chain Management. The Sustainable Development Senior implementing the Group’s policies in these fields for all sites within
Vice-president is ranked below the Executive Vice-president of their geographical area and for reporting on progress plans. The
Strategy & Technology (member of the Group’s Executive VPs meet every quarter to ensure coherence in the Safety and
Committee). Environment policies for the entire Group. To implement these
policies, the Safety & Environment VPs lead a network of more
The Environment VP, reporting to the Executive Vice-president of than 200managers responsible for the environmental
the Global Supply Chain (a member of the Group’s Executive
2
management of industrial, logistic and administrative sites.
Committee), defines and rolls out the environmental policies and
programs; this person reports the results and leads the This network has access to a wide range of management and
environmental manager network comprising: experience sharing resources including directives, application
guides, an intranet site and databases.
for product management: environmental managers in each
l
business who are responsible for integrating environmental The Transport Director, within Global Supply Chain Management,
concerns in line-up management, environmental is in charge of measuring and reducing freight CO2 emissions at
representatives who are responsible for assessing the impact Group level.
on marketing, and environmental specialists with expertise in To educate all employees on environmental issues, e-learning
integrating environmental aspects into product design; modules have been developed, including the eco-responsible
for site management: environmental managers in each major
l
management of energy and environment. These modules
zone, environmental managers in each large region with complement the existing technical training employees receive. In
significant business volume, and environmental managers in addition, an Intranet environment is accessible by all employees
each plant or supply chain centre. and expanded continuously to inform everyone at all levels about
our programs and the contribution of each one.
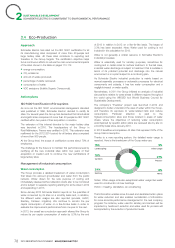
Reduction of CO2 Emissions
3.2
Approach
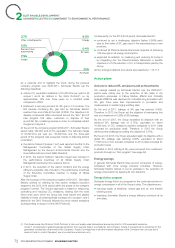
The main sources of emissions remain the same: purchase of raw
materials and equipment represents 74% of the total. Logistics,
Schneider Electric is not subject to European quotas on carbon including upstream freight from first tier suppliers and downstream
emissions since it is an industrial business that globally produces freight to first tier customers, represents 7.5%, of which the main
few emissions in comparison to energy intensive industries. part comes from road freight. Emissions in Group buildings
Schneider Electric is therefore classified in the low emissions (scopes 1 and 2) represent around 10%. More modest items
sector by CDP. –employees’ travels and waste– represent 6% and 1%
respectively.
The ranking of the company in CDP progresses every year. In
2013, Schneider Electric scored 97/100. The Group has been Since the last assessment, the Group has been able to improve
selected in the Carbon Disclosure Leadership Index and the the coverage of its carbon impact, in particular thanks to a better
Carbon Performance Leadership Index. accuracy in the measurement of its real estate and purchases. As
a result of this wider coverage, the raw emissions of these two
The Group has defined measures to continuously reduce its items have increased on a current basis.
carbon emissions.
The three items on which the Group has set action plans and
In 2013-2014, Schneider Electric updated the carbon footprint targets had their raw emissions decreased between 2011 and
assessment performed in 2012 (based on 2011 data)from its 2013: transportation paid by the Group (-12%), waste (-10%), and
upstream suppliers to its downstream distribution chain. SF6 leaks in industrial processes (-36%).
71
2013 REGISTRATION DOCUMENT SCHNEIDER ELECTRIC