APC 2013 Annual Report Download - page 178
Download and view the complete annual report
Please find page 178 of the 2013 APC annual report below. You can navigate through the pages in the report by either clicking on the pages listed below, or by using the keyword search tool below to find specific information within the annual report.-
 1
1 -
2
-
3
-
4
-
5
-
6
-
7
-
8
-
9
-
10
-
11
-
12
-
13
-
14
-
15
-
16
-
17
-
18
-
19
-
20
-
21
-
22
-
23
-
24
-
25
-
26
-
27
-
28
-
29
-
30
-
31
-
32
-
33
-
34
-
35
-
36
-
37
-
38
-
39
-
40
-
41
-
42
-
43
-
44
-
45
-
46
-
47
-
48
-
49
-
50
-
51
-
52
-
53
-
54
-
55
-
56
-
57
-
58
-
59
-
60
-
61
-
62
-
63
-
64
-
65
-
66
-
67
-
68
-
69
-
70
-
71
-
72
-
73
-
74
-
75
-
76
-
77
-
78
-
79
-
80
-
81
-
82
-
83
-
84
-
85
-
86
-
87
-
88
-
89
-
90
-
91
-
92
-
93
-
94
-
95
-
96
-
97
-
98
-
99
-
100
-
101
-
102
-
103
-
104
-
105
-
106
-
107
-
108
-
109
-
110
-
111
-
112
-
113
-
114
-
115
-
116
-
117
-
118
-
119
-
120
-
121
-
122
-
123
-
124
-
125
-
126
-
127
-
128
-
129
-
130
-
131
-
132
-
133
-
134
-
135
-
136
-
137
-
138
-
139
-
140
-
141
-
142
-
143
-
144
-
145
-
146
-
147
-
148
-
149
-
150
-
151
-
152
-
153
-
154
-
155
-
156
-
157
-
158
-
159
-
160
-
161
-
162
-
163
-
164
-
165
-
166
-
167
-
 168
168 -
 169
169 -
 170
170 -
 171
171 -
 172
172 -
 173
173 -
 174
174 -
 175
175 -
 176
176 -
 177
177 -
 178
178 -
 179
179 -
 180
180 -
 181
181 -
 182
182 -
 183
183 -
 184
184 -
 185
185 -
 186
186 -
 187
187 -
 188
188 -
189
-
190
-
191
-
192
-
193
-
194
-
195
-
196
-
197
-
198
-
199
-
200
-
201
-
202
-
203
-
204
-
205
-
206
-
207
-
208
-
209
-
210
-
211
-
212
-
213
-
214
-
215
-
216
-
217
-
218
-
219
-
220
-
221
-
222
-
223
-
224
-
225
-
226
-
227
-
228
-
229
-
230
-
231
-
232
-
233
-
234
-
235
-
236
-
237
-
238
-
239
-
240
-
241
-
242
-
243
-
244
-
245
-
246
-
247
-
248
-
249
-
250
-
251
-
252
-
253
-
254
-
255
-
256
-
257
-
258
-
259
-
260
-
261
-
262
-
263
-
264
-
265
-
266
-
267
-
268
-
269
-
270
-
271
-
272
-
273
-
274
-
275
-
276
-
277
-
278
-
279
-
280
-
281
-
282
-
283
-
284
-
285
-
286
-
287
-
288
-
289
-
290
-
291
-
292
-
293
-
294
-
295
-
296
-
297
-
298
-
299
-
300
-
301
-
302
-
303
-
304
-
305
-
306
-
307
-
308
-
309
-
310
-
311
-
312
-
313
-
314
-
315
-
316
-
317
-
318
-
319
-
320
-
321
-
322
-
323
-
324
-
325
-
326
-
327
-
328
-
329
-
330
-
331
-
332
 |
 |

4BUSINESS REVIEW
REVIEW OF THE CONSOLIDATED FINANCIAL STATEMENTS
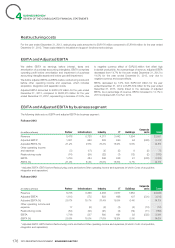
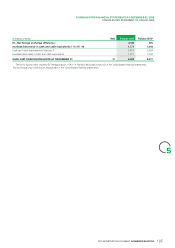
Restructuring costs
For the year ended December31, 2013, restructuring costs amounted to EUR176million compared to EUR164million for the year ended
December31, 2012. These costs related to industrial and support functions restructurings.
EBITA and Adjusted EBITA
We define EBITA as earnings before interest, taxes and to negative currency effect of EUR233million that offset high
amortization of purchase accounting intangibles. EBITA comprises industrial productivity. As a percentage of revenue, adjusted EBITA
operating profit before amortization and impairment of purchase decreased from 14.7% for the year ended December31, 2012 to
accounting intangible assets and before goodwill impairment. 14.5% for the year ended December31, 2013, only due to
negative currency and scope effects.
We define adjusted EBITA as EBITA before restructuring costs and
before other operating income and expenses, which includes EBITA decreased by 1.0% from EUR3,341million for the year
acquisition, integration and separation costs. ended December31, 2012 to EUR3,309million for the year ended
December31, 2013, mainly linked to the decrease of adjusted
Adjusted EBITA amounted to EUR3,412million for the year ended EBITA. As a percentage of revenue, EBITA increased to 14.1% in
December31, 2013, compared to EUR3,515million for the year 2013 compared with 14.0% in 2012.
ended December31, 2012, representing a decrease of 2.9%, due
EBITA and Adjusted EBITA by business segment
The following table sets out EBITA and adjusted EBITA by business segment:
Full year 2013
Corporate
(inmillions of euro) Partner Infrastructure Industry IT Buildings Totalcosts
Revenue 8,476 5,728 4,311 3,442 1,594 - 23,551
Adjusted EBITA* 1,801 560 833 650 94 (526) 3,412
Adjusted EBITA (%) 21.2% 9.8% 19.3% 18.9% 5.9% - 14.5%
Other operating income
53 (17) 35 (5) 9 (2) 73andexpense
Restructuring costs (74) (59) (22) (7) (12) (2) (176)
EBITA 1,780 484 846 638 91 (530) 3,309
EBITA (%) 21.0% 8.4% 19.6% 18.5% 5.7% - 14.1%
* Adjusted EBITA: EBITA before Restructuring costs and before Other operating income and expenses (of which Costs of acquisition,
integration and separation).
Full year 2012
Corporate
(inmillions of euro) Partner Infrastructure Industry IT Buildings Totalcosts
Revenue 8,738 5,366 4,483 3,677 1,682 - 23,946
Adjusted EBITA* 1,813 575 823 698 107 (501) 3,515
Adjusted EBITA (%) 20.7% 10.7% 18.4% 19.0% 6.4% - 14.7%
Other operating income and
17 (6) (2) (3) (3) (13) (10)expense
Restructuring costs (84) (32) (21) (4) (12) (11) (164)
EBITA 1,746 537 800 691 92 (525) 3,341
EBITA (%) 20.0% 10.0% 17.8% 18.8% 5.5% 14.0%
* Adjusted EBITA: EBITA before Restructuring costs and before Other operating income and expenses (of which Costs of acquisition,
integration and separation).
176 2013 REGISTRATION DOCUMENT SCHNEIDER ELECTRIC