APC 2013 Annual Report Download - page 72
Download and view the complete annual report
Please find page 72 of the 2013 APC annual report below. You can navigate through the pages in the report by either clicking on the pages listed below, or by using the keyword search tool below to find specific information within the annual report.-
 1
1 -
2
-
3
-
4
-
5
-
6
-
7
-
8
-
9
-
10
-
11
-
12
-
13
-
14
-
15
-
16
-
17
-
18
-
19
-
20
-
21
-
22
-
23
-
24
-
25
-
26
-
27
-
28
-
29
-
30
-
31
-
32
-
33
-
34
-
35
-
36
-
37
-
38
-
39
-
40
-
41
-
42
-
43
-
44
-
45
-
46
-
47
-
48
-
49
-
50
-
51
-
52
-
53
-
54
-
55
-
56
-
57
-
58
-
59
-
60
-
61
-
 62
62 -
 63
63 -
 64
64 -
 65
65 -
 66
66 -
 67
67 -
 68
68 -
 69
69 -
 70
70 -
 71
71 -
 72
72 -
 73
73 -
 74
74 -
 75
75 -
 76
76 -
 77
77 -
 78
78 -
 79
79 -
 80
80 -
 81
81 -
 82
82 -
83
-
84
-
85
-
86
-
87
-
88
-
89
-
90
-
91
-
92
-
93
-
94
-
95
-
96
-
97
-
98
-
99
-
100
-
101
-
102
-
103
-
104
-
105
-
106
-
107
-
108
-
109
-
110
-
111
-
112
-
113
-
114
-
115
-
116
-
117
-
118
-
119
-
120
-
121
-
122
-
123
-
124
-
125
-
126
-
127
-
128
-
129
-
130
-
131
-
132
-
133
-
134
-
135
-
136
-
137
-
138
-
139
-
140
-
141
-
142
-
143
-
144
-
145
-
146
-
147
-
148
-
149
-
150
-
151
-
152
-
153
-
154
-
155
-
156
-
157
-
158
-
159
-
160
-
161
-
162
-
163
-
164
-
165
-
166
-
167
-
168
-
169
-
170
-
171
-
172
-
173
-
174
-
175
-
176
-
177
-
178
-
179
-
180
-
181
-
182
-
183
-
184
-
185
-
186
-
187
-
188
-
189
-
190
-
191
-
192
-
193
-
194
-
195
-
196
-
197
-
198
-
199
-
200
-
201
-
202
-
203
-
204
-
205
-
206
-
207
-
208
-
209
-
210
-
211
-
212
-
213
-
214
-
215
-
216
-
217
-
218
-
219
-
220
-
221
-
222
-
223
-
224
-
225
-
226
-
227
-
228
-
229
-
230
-
231
-
232
-
233
-
234
-
235
-
236
-
237
-
238
-
239
-
240
-
241
-
242
-
243
-
244
-
245
-
246
-
247
-
248
-
249
-
250
-
251
-
252
-
253
-
254
-
255
-
256
-
257
-
258
-
259
-
260
-
261
-
262
-
263
-
264
-
265
-
266
-
267
-
268
-
269
-
270
-
271
-
272
-
273
-
274
-
275
-
276
-
277
-
278
-
279
-
280
-
281
-
282
-
283
-
284
-
285
-
286
-
287
-
288
-
289
-
290
-
291
-
292
-
293
-
294
-
295
-
296
-
297
-
298
-
299
-
300
-
301
-
302
-
303
-
304
-
305
-
306
-
307
-
308
-
309
-
310
-
311
-
312
-
313
-
314
-
315
-
316
-
317
-
318
-
319
-
320
-
321
-
322
-
323
-
324
-
325
-
326
-
327
-
328
-
329
-
330
-
331
-
332
 |
 |

2SUSTAINABLE DEVELOPMENT
SCHNEIDER ELECTRIC’S COMMITMENT TO ENVIRONMENTAL PERFORMANCE
Schneider Electric’s commitment
3.
toenvironmental performance
This chapter deals with the environmental impact of the Group’s industrial activities. The products and solutions offered by Schneider
Electric which help reduce the environmental impacts of our customers’ activities are described in part2 (page62).
Overview
3.1
Context and aims
to roll out energy efficiency monitoring solutions to sites larger
l
than 5,000m² and to several strategic sites (i.e., a total of more
Schneider Electric does not produce nor distribute energy. It than 300) covering 90% of the Group’s total consumption, and
conceives and builds electrical products and proposes integral reduce the energy consumption at these sites by 10% in three
solutions for a number of market segments. The great majority of years (Energy Action program);
these products are installation components for energy limit leaks of SF6 to 0.75% of the consumption of that gas at
l
management. They consume little energy compared with the those sites;
devices they control, and the losses through dissipation are reduce the CO2 emissions associated with transportation paid
l
negligible compared with the energy in transit. Production by the Group by 10%;
activities, for their part, mainly call on assembly and control
techniques and only minimally integrate procedures with a reduce the Group’s water consumption with specific objectives
l
significant environmental impact, such as the transformation and and action plans for the sites with the highest water
treatment of metals. consumption and those located in areas of water stress, and
control the deviations (+/-10%) of all sites that report water
With a company presence in more than 100countries resulting consumption;
from a continual rhythm of internal development as well as monitor VOC emissions (Volatile Organic Compounds) for all
l
acquisitions, Schneider Electric applies a common environmental ISO14001 sites holding emissions permits or emitting more
policy to all its entities and rolls out the same programs for than one ton per year;
certification, reporting and performance objective throughout all its
geographical locations. achieve an 85% industrial waste recycling rate;
l
Schneider Electric commits to protecting the environment and achieve 75% of product revenue from products that have a
l
health through the following objectives contained in the Connect life-cycle analysis and controlled and limited chemical substance
company program: usage (Green Premium eco-mark).
For this section, three key performance indicators were set in the
to roll out ISO14001 certification and the Group’s environmental
l
Planet&Society Barometer for the duration of the Connect
reporting to 100% of the industrial sites and logistics centres program (2012-2014):
(more than 50people) within two years after their creation or
acquisition, and to the large tertiary sites (more than
500people);
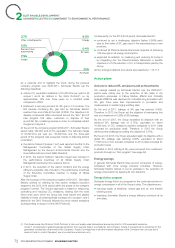
Objectives for year end 2014 2013 2012 2011
1. 10% CO2 savings on transportation 16.7% ▲14.8% -
2. 75% of our product revenues achieved with Green Premium 68.7% ▲65.5% 63%
3. 10% energy consumption savings 8% ▲6.1% -
The 2011 performance serves as a starting value for the Planet&Society Barometer Connect program between 2012 and 2014.
▲ 2013 Audited Indicators.
Please refer to pages 105 to 108 for the methodological presentation of indicators and the following pages for the analysis of the results
(pages 74 for indicator1, 75-77 for indicator2 and 72-73 for indicator3).
70 2013 REGISTRATION DOCUMENT SCHNEIDER ELECTRIC