APC 2013 Annual Report Download - page 239
Download and view the complete annual report
Please find page 239 of the 2013 APC annual report below. You can navigate through the pages in the report by either clicking on the pages listed below, or by using the keyword search tool below to find specific information within the annual report.-
 1
1 -
2
-
3
-
4
-
5
-
6
-
7
-
8
-
9
-
10
-
11
-
12
-
13
-
14
-
15
-
16
-
17
-
18
-
19
-
20
-
21
-
22
-
23
-
24
-
25
-
26
-
27
-
28
-
29
-
30
-
31
-
32
-
33
-
34
-
35
-
36
-
37
-
38
-
39
-
40
-
41
-
42
-
43
-
44
-
45
-
46
-
47
-
48
-
49
-
50
-
51
-
52
-
53
-
54
-
55
-
56
-
57
-
58
-
59
-
60
-
61
-
62
-
63
-
64
-
65
-
66
-
67
-
68
-
69
-
70
-
71
-
72
-
73
-
74
-
75
-
76
-
77
-
78
-
79
-
80
-
81
-
82
-
83
-
84
-
85
-
86
-
87
-
88
-
89
-
90
-
91
-
92
-
93
-
94
-
95
-
96
-
97
-
98
-
99
-
100
-
101
-
102
-
103
-
104
-
105
-
106
-
107
-
108
-
109
-
110
-
111
-
112
-
113
-
114
-
115
-
116
-
117
-
118
-
119
-
120
-
121
-
122
-
123
-
124
-
125
-
126
-
127
-
128
-
129
-
130
-
131
-
132
-
133
-
134
-
135
-
136
-
137
-
138
-
139
-
140
-
141
-
142
-
143
-
144
-
145
-
146
-
147
-
148
-
149
-
150
-
151
-
152
-
153
-
154
-
155
-
156
-
157
-
158
-
159
-
160
-
161
-
162
-
163
-
164
-
165
-
166
-
167
-
168
-
169
-
170
-
171
-
172
-
173
-
174
-
175
-
176
-
177
-
178
-
179
-
180
-
181
-
182
-
183
-
184
-
185
-
186
-
187
-
188
-
189
-
190
-
191
-
192
-
193
-
194
-
195
-
196
-
197
-
198
-
199
-
200
-
201
-
202
-
203
-
204
-
205
-
206
-
207
-
208
-
209
-
210
-
211
-
212
-
213
-
214
-
215
-
216
-
217
-
218
-
219
-
220
-
221
-
222
-
223
-
224
-
225
-
226
-
227
-
228
-
 229
229 -
 230
230 -
 231
231 -
 232
232 -
 233
233 -
 234
234 -
 235
235 -
 236
236 -
 237
237 -
 238
238 -
 239
239 -
 240
240 -
 241
241 -
 242
242 -
 243
243 -
 244
244 -
 245
245 -
 246
246 -
 247
247 -
 248
248 -
 249
249 -
250
-
251
-
252
-
253
-
254
-
255
-
256
-
257
-
258
-
259
-
260
-
261
-
262
-
263
-
264
-
265
-
266
-
267
-
268
-
269
-
270
-
271
-
272
-
273
-
274
-
275
-
276
-
277
-
278
-
279
-
280
-
281
-
282
-
283
-
284
-
285
-
286
-
287
-
288
-
289
-
290
-
291
-
292
-
293
-
294
-
295
-
296
-
297
-
298
-
299
-
300
-
301
-
302
-
303
-
304
-
305
-
306
-
307
-
308
-
309
-
310
-
311
-
312
-
313
-
314
-
315
-
316
-
317
-
318
-
319
-
320
-
321
-
322
-
323
-
324
-
325
-
326
-
327
-
328
-
329
-
330
-
331
-
332
 |
 |

CONSOLIDATED FINANCIALSTATEMENTS ATDECEMBER 31, 2013
NOTES TO THE CONSOLIDATED FINANCIAL STATEMENTS
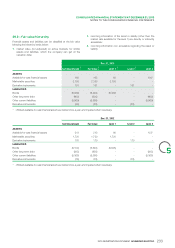
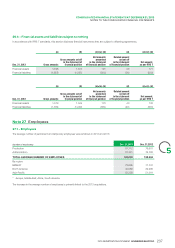
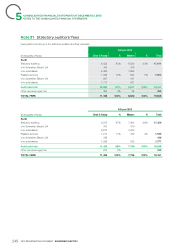
26.4 – Financial assets and liabilities subject to netting
In accordance with IFRS7 standards, this section discloses financial instruments that are subject to offsetting agreements.
(a) (b) (c)=(a)-(b) (d) (e)=(c)-(d)
Net amounts Related amount
Gross amounts set off presented not set off
Net amount,in the statement of in the statement in the statement
Dec. 31, 2013 Gross amounts financial position of financial position of financial position as per IFRS7
Financial assets 1,528 1,337 191 20 171
Financial liabilities (1,587) (1,337) (250) (20) (230)
(a) (b) (c)=(a)-(b) (d) (e)=(c)-(d)
Net amounts Related amount
Gross amounts set off presented not set off
Net amount,in the statement of in the statement in the statement
Dec. 31, 2012 Gross amounts financial position of financial position of financial position as per IFRS7
Financial assets 1,519 1,349 170 40 130
Financial liabilities (1,709) (1,349) (360) (40) (320)
Employees
Note27
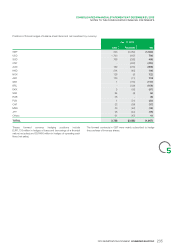
27.1 – Employees
The average number of permanent and temporary employees was as follows in2012 and 2013:
(number of employees) Dec. 31,2013 Dec. 31,2012
5
Production 81,712 75,601
Administration 81,321 76,783
TOTAL AVERAGE NUMBER OF EMPLOYEES 163,033 152,384
By region:
EMEAS* 78,695 71,737
North America 30,980 29,286
Asia-Pacific 53,358 51,361
Europe, Middle-East, Africa, SouthAmerica.*
The increase in the average number of employees is primarily linked to the 2013 acquisitions.
237
2013 REGISTRATION DOCUMENT SCHNEIDER ELECTRIC