APC 2013 Annual Report Download - page 74
Download and view the complete annual report
Please find page 74 of the 2013 APC annual report below. You can navigate through the pages in the report by either clicking on the pages listed below, or by using the keyword search tool below to find specific information within the annual report.-
 1
1 -
2
-
3
-
4
-
5
-
6
-
7
-
8
-
9
-
10
-
11
-
12
-
13
-
14
-
15
-
16
-
17
-
18
-
19
-
20
-
21
-
22
-
23
-
24
-
25
-
26
-
27
-
28
-
29
-
30
-
31
-
32
-
33
-
34
-
35
-
36
-
37
-
38
-
39
-
40
-
41
-
42
-
43
-
44
-
45
-
46
-
47
-
48
-
49
-
50
-
51
-
52
-
53
-
54
-
55
-
56
-
57
-
58
-
59
-
60
-
61
-
62
-
63
-
 64
64 -
 65
65 -
 66
66 -
 67
67 -
 68
68 -
 69
69 -
 70
70 -
 71
71 -
 72
72 -
 73
73 -
 74
74 -
 75
75 -
 76
76 -
 77
77 -
 78
78 -
 79
79 -
 80
80 -
 81
81 -
 82
82 -
 83
83 -
 84
84 -
85
-
86
-
87
-
88
-
89
-
90
-
91
-
92
-
93
-
94
-
95
-
96
-
97
-
98
-
99
-
100
-
101
-
102
-
103
-
104
-
105
-
106
-
107
-
108
-
109
-
110
-
111
-
112
-
113
-
114
-
115
-
116
-
117
-
118
-
119
-
120
-
121
-
122
-
123
-
124
-
125
-
126
-
127
-
128
-
129
-
130
-
131
-
132
-
133
-
134
-
135
-
136
-
137
-
138
-
139
-
140
-
141
-
142
-
143
-
144
-
145
-
146
-
147
-
148
-
149
-
150
-
151
-
152
-
153
-
154
-
155
-
156
-
157
-
158
-
159
-
160
-
161
-
162
-
163
-
164
-
165
-
166
-
167
-
168
-
169
-
170
-
171
-
172
-
173
-
174
-
175
-
176
-
177
-
178
-
179
-
180
-
181
-
182
-
183
-
184
-
185
-
186
-
187
-
188
-
189
-
190
-
191
-
192
-
193
-
194
-
195
-
196
-
197
-
198
-
199
-
200
-
201
-
202
-
203
-
204
-
205
-
206
-
207
-
208
-
209
-
210
-
211
-
212
-
213
-
214
-
215
-
216
-
217
-
218
-
219
-
220
-
221
-
222
-
223
-
224
-
225
-
226
-
227
-
228
-
229
-
230
-
231
-
232
-
233
-
234
-
235
-
236
-
237
-
238
-
239
-
240
-
241
-
242
-
243
-
244
-
245
-
246
-
247
-
248
-
249
-
250
-
251
-
252
-
253
-
254
-
255
-
256
-
257
-
258
-
259
-
260
-
261
-
262
-
263
-
264
-
265
-
266
-
267
-
268
-
269
-
270
-
271
-
272
-
273
-
274
-
275
-
276
-
277
-
278
-
279
-
280
-
281
-
282
-
283
-
284
-
285
-
286
-
287
-
288
-
289
-
290
-
291
-
292
-
293
-
294
-
295
-
296
-
297
-
298
-
299
-
300
-
301
-
302
-
303
-
304
-
305
-
306
-
307
-
308
-
309
-
310
-
311
-
312
-
313
-
314
-
315
-
316
-
317
-
318
-
319
-
320
-
321
-
322
-
323
-
324
-
325
-
326
-
327
-
328
-
329
-
330
-
331
-
332
 |
 |
2SUSTAINABLE DEVELOPMENT
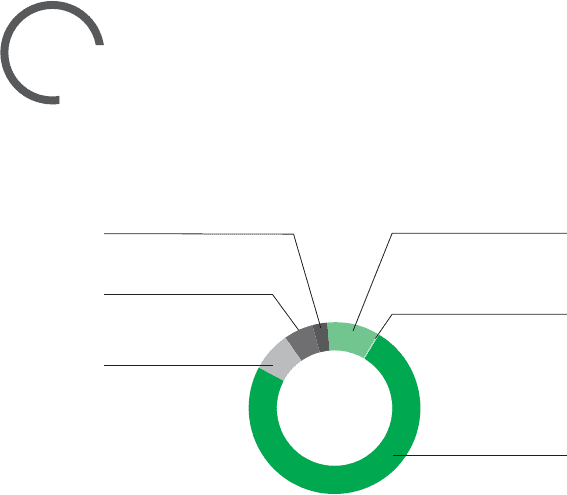
SCHNEIDER ELECTRIC’S COMMITMENT TO ENVIRONMENTAL PERFORMANCE
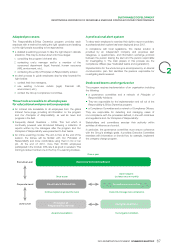
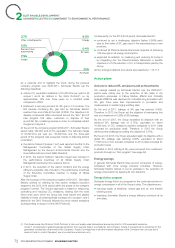
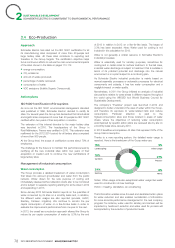
5.6%
Business travel
& commuting
7.5%
Freight
9.8%
Energy
2.7%
Other, including waste
0.4%
SF6 leaks
74%
Purchases
Consequently, for the 2012-2014 period, Schneider Electric:
continued to set a challenging objective (below 0.95%) each
l
year to limit leaks of SF6 gas used in the manufacturing of new
products;
confirmed its Planet&Society Barometer objective of achieving
l
10% savings on its energy consumption;
expanded its ambition on measuring and reducing its scope3
l
by integrating into the Planet&Society Barometer a specific
objective of a 10% reduction in CO2 in transportation paid by the
Group.
All CO2 savings indicators and results are presented p. 113-115
Action plans
As a reminder and to highlight the trend, during the previous
Actions to reduce SF6 emissions and achievements
company program over 2009-2011, Schneider Electric set the
following objectives: CO2 savings realized by Schneider Electric over the 2009-2011
period were mainly due to the reduction of SF6 leaks in the
reduce CO2 equivalent emissions of 30,000tons per year for all
l
production processes. A Failure Modes, Effects and Criticality
scopes1 and2 as defined in the GHG Protocol(1) i.e. by
Analysis (FMECA) was deployed for manufacturing processes with
approximately 15% over three years on a constant basis
SF6 gas; there were also improvements in processes and
compared to2008;
measurement on certain highly emitting sites.
implement a recovery process for SF6 gas in 12countries. The
l
first devices containing SF6 gas sold by Schneider Electric By the end of2011, leakage of SF6 gas has reached 0.95%.
reached their end-of-life at the start of2000. The objective is to Therefore, in 2012 the Group set the objective of maintaining this
develop commercial offers structured around the “EoL” (End of rate at a maximum of 0.95% of SF6 leakage.
Life) program that allow customers to dispose of their By the end of 2012, the Group exceeded its objective with an
end-of-life, SF6 containing devices in order to completely extract achieved SF6 leakage rate of 0.75%, equivalent to about
the gas and recycle it. 10,400tons of CO2 emissions avoided compared to2011 (data
At the end of the company program 2009-2011, Schneider Electric corrected for production level). Therefore, in 2013 the Group
saved nearly 162,000tons of CO2 equivalent. The reduction target reinforced the challenge by setting the objective at 0.75%.
of 30,000tons per year (i.e., 90,000tons over the three-year By the end of 2013, the Group exceeded again its objective with a
period of the program) was exceeded, thanks to following actions global SF6 leakage rate reaching 0.56%, equivalent to about
undertaken: 11,500 tons of CO2 avoided compared to2012 (data corrected for
the carbon footprint (scopes1 &2) was reported monthly to the
l
production level).
Management Committee of the Global Supply Chain In parallel, in 2013, 669kg of SF6 were recovered from customers’
Management by the Group’s Environmental Director and the products through our “EoL program” (see page64).
three Safety & Environment (S&E) Directors;
Energy savings
in2010, the carbon footprint reduction target was included in
l
the performance incentives of all Global Supply Chain
Management personnel who receive a bonus; In general, Schneider Electric sites are low consumers of energy,
compared with more energy intensive industries. However,
in2011, the reduction of the carbon footprint and the energy
l
Schneider Electric wishes to set an example in the reduction of
efficiency programs was included in the performance incentives energy consumption by applying its own solutions.
of the Executive Committee member in charge of Global
SupplyChain.
Energy Action program
After the success of the company program 2009-2011, Schneider Schneider Energy Action is a program for the continual reduction in
Electric worked on defining its new carbon emission reduction energy consumption in all of the Group’s sites. The objectives are:
targets for the 2012-2014 period within the scope of the company
reducing waste of electricity, natural gas and oil, and thereby
l
program Connect. The Group’s approach is based on measuring,
lowering costs;
controlling and reducing CO2 emissions, starting with the most
direct ones upon which the Group has most impact and greater deploying Schneider Electric’s energy efficiency solutions at its
l
reliability in terms of metering (these correspond to scopes1 and2 own sites;
defined in the GHG Protocol) followed by more indirect emissions
(corresponding to scope3 of the GHG Protocol).
The Greenhouse Gas Protocol (GHG Protocol) is the most widely-used international accounting tool for CO2-equivalent emissions. (1)
Scope 1 corresponds to greenhouse gas emissions from sources held or controlled by the Company. Scope 2 corresponds to emissions for the
generation of electricity consumed by the Company. Scope 3 corresponds to all other indirect emissions of the Company from sources that it
does not hold or control (transport, use of products and services, etc.).
72 2013 REGISTRATION DOCUMENT SCHNEIDER ELECTRIC