APC 2013 Annual Report Download - page 119
Download and view the complete annual report
Please find page 119 of the 2013 APC annual report below. You can navigate through the pages in the report by either clicking on the pages listed below, or by using the keyword search tool below to find specific information within the annual report.-
 1
1 -
2
-
3
-
4
-
5
-
6
-
7
-
8
-
9
-
10
-
11
-
12
-
13
-
14
-
15
-
16
-
17
-
18
-
19
-
20
-
21
-
22
-
23
-
24
-
25
-
26
-
27
-
28
-
29
-
30
-
31
-
32
-
33
-
34
-
35
-
36
-
37
-
38
-
39
-
40
-
41
-
42
-
43
-
44
-
45
-
46
-
47
-
48
-
49
-
50
-
51
-
52
-
53
-
54
-
55
-
56
-
57
-
58
-
59
-
60
-
61
-
62
-
63
-
64
-
65
-
66
-
67
-
68
-
69
-
70
-
71
-
72
-
73
-
74
-
75
-
76
-
77
-
78
-
79
-
80
-
81
-
82
-
83
-
84
-
85
-
86
-
87
-
88
-
89
-
90
-
91
-
92
-
93
-
94
-
95
-
96
-
97
-
98
-
99
-
100
-
101
-
102
-
103
-
104
-
105
-
106
-
107
-
108
-
 109
109 -
 110
110 -
 111
111 -
 112
112 -
 113
113 -
 114
114 -
 115
115 -
 116
116 -
 117
117 -
 118
118 -
 119
119 -
 120
120 -
 121
121 -
 122
122 -
 123
123 -
 124
124 -
 125
125 -
 126
126 -
 127
127 -
 128
128 -
 129
129 -
130
-
131
-
132
-
133
-
134
-
135
-
136
-
137
-
138
-
139
-
140
-
141
-
142
-
143
-
144
-
145
-
146
-
147
-
148
-
149
-
150
-
151
-
152
-
153
-
154
-
155
-
156
-
157
-
158
-
159
-
160
-
161
-
162
-
163
-
164
-
165
-
166
-
167
-
168
-
169
-
170
-
171
-
172
-
173
-
174
-
175
-
176
-
177
-
178
-
179
-
180
-
181
-
182
-
183
-
184
-
185
-
186
-
187
-
188
-
189
-
190
-
191
-
192
-
193
-
194
-
195
-
196
-
197
-
198
-
199
-
200
-
201
-
202
-
203
-
204
-
205
-
206
-
207
-
208
-
209
-
210
-
211
-
212
-
213
-
214
-
215
-
216
-
217
-
218
-
219
-
220
-
221
-
222
-
223
-
224
-
225
-
226
-
227
-
228
-
229
-
230
-
231
-
232
-
233
-
234
-
235
-
236
-
237
-
238
-
239
-
240
-
241
-
242
-
243
-
244
-
245
-
246
-
247
-
248
-
249
-
250
-
251
-
252
-
253
-
254
-
255
-
256
-
257
-
258
-
259
-
260
-
261
-
262
-
263
-
264
-
265
-
266
-
267
-
268
-
269
-
270
-
271
-
272
-
273
-
274
-
275
-
276
-
277
-
278
-
279
-
280
-
281
-
282
-
283
-
284
-
285
-
286
-
287
-
288
-
289
-
290
-
291
-
292
-
293
-
294
-
295
-
296
-
297
-
298
-
299
-
300
-
301
-
302
-
303
-
304
-
305
-
306
-
307
-
308
-
309
-
310
-
311
-
312
-
313
-
314
-
315
-
316
-
317
-
318
-
319
-
320
-
321
-
322
-
323
-
324
-
325
-
326
-
327
-
328
-
329
-
330
-
331
-
332
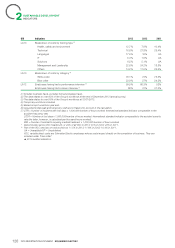
 |
 |

SUSTAINABLE DEVELOPMENT
INDICATORS
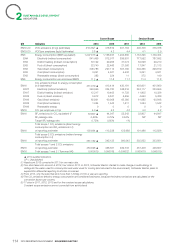
GRI Indicators 2013 2012 2011
LA13 Breakdown of workforce by gender(2)
Men 70%▲69% 68%
Women 30% ▲31% 32%
LA13 Breakdown of workforce by gender and by category(2)
White collar 53.7% 53.2% 54.5%
Men 71% 72% 72%
Women 29% 28% 28%
2
Blue collar 46.3% 46.8% 45.5%
Men 69% 65% 64%
Women 31% 35% 36%
LA13 Breakdown of workforce by age(2)
14/24 years 8.4% 9.2% 9.7%
25/34 years 32.5% 33.2% 32.7%
35/44 years 27.8% 26.8% 36.4%
45/54 years 20.9% 20.7% 21.2%
55/64 years 9.9% 9.5% 9.6%
>64 years 0.5% 0.6% 0.4%
LA1 Breakdown of workforce by seniority(2)
<5 years 42.6% 42.9% 44.2%
5/14 years 34.9% 33.5% 29.9%
15/24 years 12.6% 13.2% 13.8%
25/34 years 7.1% 7.2% 8.8%
>34 years 2.8% 3.2% 3.3%
LA1 Breakdown of workforce by function
Marketing 3.7% 3.8% 3.8%
Sales 10.6% 11.4% 12%
Services and projects** 16.0% 16.4% 15%
Support 19.5% 19.6% 19.2%
Technical 7.6% 7.6% 8.4%
Industrial 6% 6% 6.4%
LA1 Direct variable costs* (cost of employees under production or business costs) 47.4% 46.7% 45.4%
Hires(6)
LA2 Breakdown by type of contract
Permanent contract 67% 67% 61.2%
Fixed-term contract 33% 33% 38.8%
LA2 Breakdown by category
White collar 44% 44% 51.3%
Blue collar 56% 56% 48.7%
LA2 Breakdown by Region
Asia-Pacific 38% 45% 47%
Europe 22% 21% 23%
North America 25% 21% 17%
Rest of the world 15% 13% 13%
Layoffs(6)
LA2 Breakdown by type of contract
Permanent contract 85% 83% 81%
Fixed-term contract 15% 17% 19%
LA2 Breakdown by category
White collar 41% 45% 45%
Blue collar 59% 55% 55%
117
2013 REGISTRATION DOCUMENT SCHNEIDER ELECTRIC