APC 2013 Annual Report Download - page 260
Download and view the complete annual report
Please find page 260 of the 2013 APC annual report below. You can navigate through the pages in the report by either clicking on the pages listed below, or by using the keyword search tool below to find specific information within the annual report.-
 1
1 -
2
-
3
-
4
-
5
-
6
-
7
-
8
-
9
-
10
-
11
-
12
-
13
-
14
-
15
-
16
-
17
-
18
-
19
-
20
-
21
-
22
-
23
-
24
-
25
-
26
-
27
-
28
-
29
-
30
-
31
-
32
-
33
-
34
-
35
-
36
-
37
-
38
-
39
-
40
-
41
-
42
-
43
-
44
-
45
-
46
-
47
-
48
-
49
-
50
-
51
-
52
-
53
-
54
-
55
-
56
-
57
-
58
-
59
-
60
-
61
-
62
-
63
-
64
-
65
-
66
-
67
-
68
-
69
-
70
-
71
-
72
-
73
-
74
-
75
-
76
-
77
-
78
-
79
-
80
-
81
-
82
-
83
-
84
-
85
-
86
-
87
-
88
-
89
-
90
-
91
-
92
-
93
-
94
-
95
-
96
-
97
-
98
-
99
-
100
-
101
-
102
-
103
-
104
-
105
-
106
-
107
-
108
-
109
-
110
-
111
-
112
-
113
-
114
-
115
-
116
-
117
-
118
-
119
-
120
-
121
-
122
-
123
-
124
-
125
-
126
-
127
-
128
-
129
-
130
-
131
-
132
-
133
-
134
-
135
-
136
-
137
-
138
-
139
-
140
-
141
-
142
-
143
-
144
-
145
-
146
-
147
-
148
-
149
-
150
-
151
-
152
-
153
-
154
-
155
-
156
-
157
-
158
-
159
-
160
-
161
-
162
-
163
-
164
-
165
-
166
-
167
-
168
-
169
-
170
-
171
-
172
-
173
-
174
-
175
-
176
-
177
-
178
-
179
-
180
-
181
-
182
-
183
-
184
-
185
-
186
-
187
-
188
-
189
-
190
-
191
-
192
-
193
-
194
-
195
-
196
-
197
-
198
-
199
-
200
-
201
-
202
-
203
-
204
-
205
-
206
-
207
-
208
-
209
-
210
-
211
-
212
-
213
-
214
-
215
-
216
-
217
-
218
-
219
-
220
-
221
-
222
-
223
-
224
-
225
-
226
-
227
-
228
-
229
-
230
-
231
-
232
-
233
-
234
-
235
-
236
-
237
-
238
-
239
-
240
-
241
-
242
-
243
-
244
-
245
-
246
-
247
-
248
-
249
-
 250
250 -
 251
251 -
 252
252 -
 253
253 -
 254
254 -
 255
255 -
 256
256 -
 257
257 -
 258
258 -
 259
259 -
 260
260 -
 261
261 -
 262
262 -
 263
263 -
 264
264 -
 265
265 -
 266
266 -
 267
267 -
 268
268 -
 269
269 -
 270
270 -
271
-
272
-
273
-
274
-
275
-
276
-
277
-
278
-
279
-
280
-
281
-
282
-
283
-
284
-
285
-
286
-
287
-
288
-
289
-
290
-
291
-
292
-
293
-
294
-
295
-
296
-
297
-
298
-
299
-
300
-
301
-
302
-
303
-
304
-
305
-
306
-
307
-
308
-
309
-
310
-
311
-
312
-
313
-
314
-
315
-
316
-
317
-
318
-
319
-
320
-
321
-
322
-
323
-
324
-
325
-
326
-
327
-
328
-
329
-
330
-
331
-
332
 |
 |
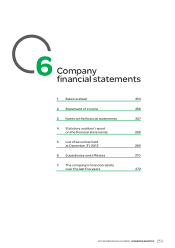
6COMPANY FINANCIALSTATEMENTS
NOTES TO THE FINANCIAL STATEMENTS
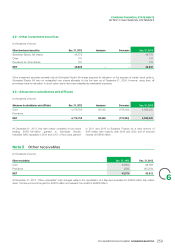
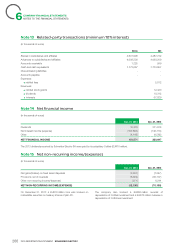
Currency risk Bonds
Where necessary, a contingency provision is in place for unrealized Redemption premiums and issue costs are amortized over the life
exchange losses. However, where there are unrealized exchange of the bonds.
gains and losses on back-to-back transactions in the same
currency and with the same maturity, the amount of the provision
is then limited to the net loss.
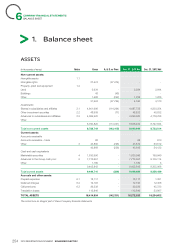
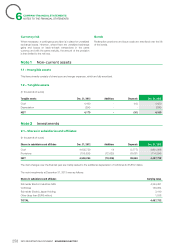
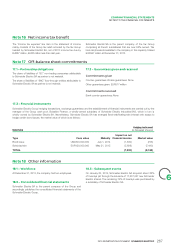
Non-current assets
Note1
1.1 – Intangible assets
This item primarily consists of share issue and merger expenses, which are fully amortized.
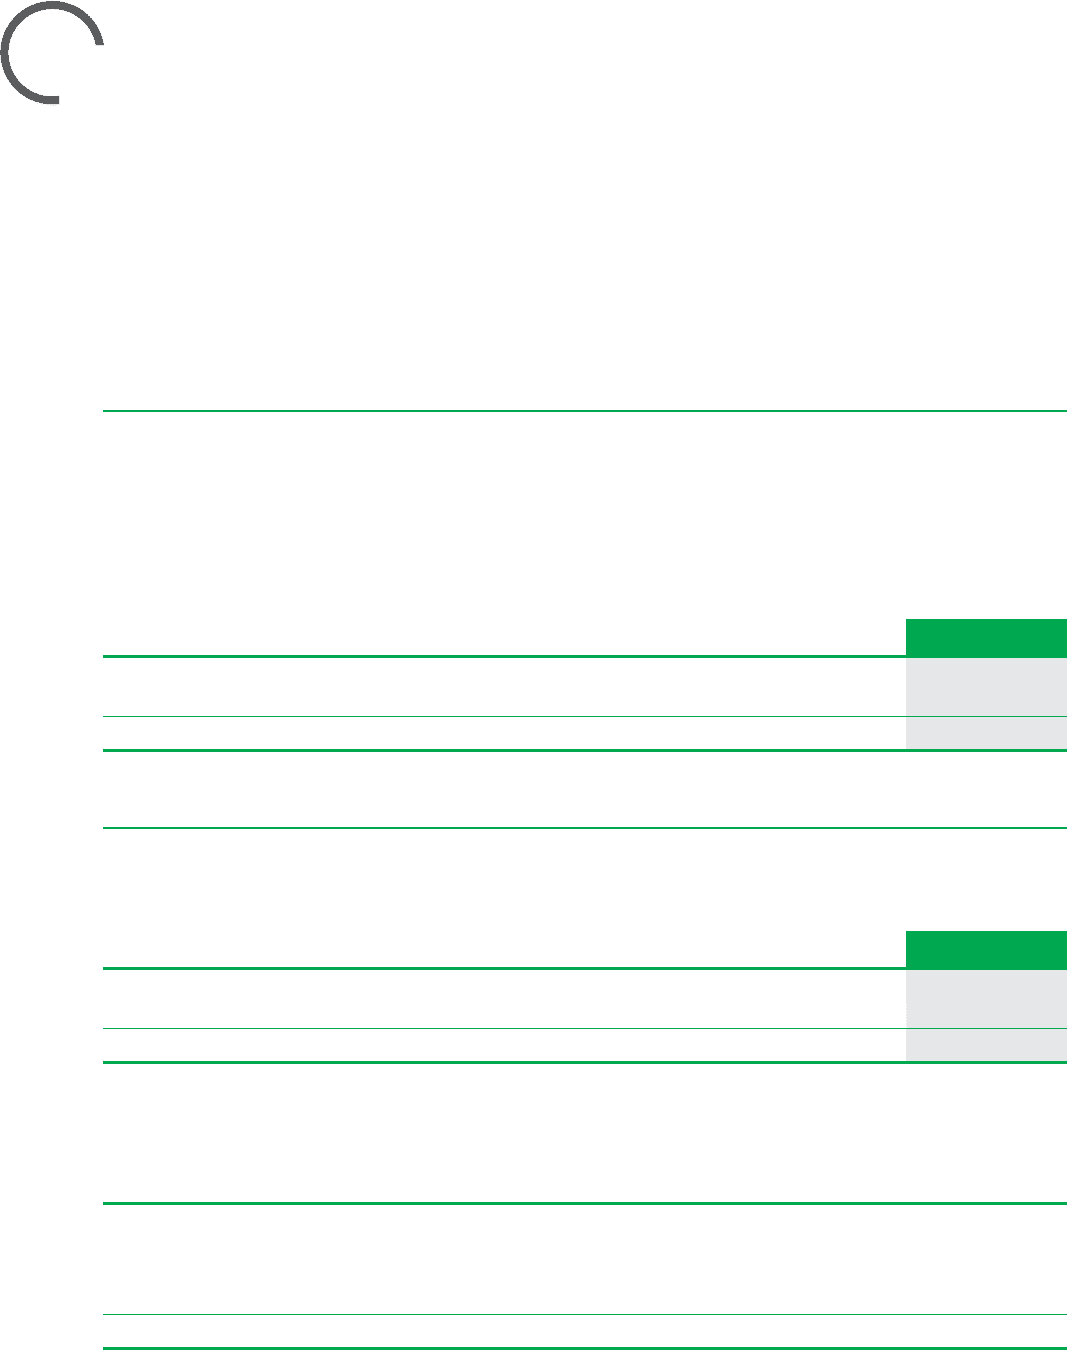
1.2 – Tangible assets
(in thousands of euros)
Tangible assets Dec.31, 2012 Additions Disposals Dec.31, 2013
Cost 4,460 - (10) 4,450
Depreciation (290) - - (290)
NET 4,170 - (10) 4,160
Investments
Note2
2.1 – Shares in subsidiaries and affiliates
(in thousands of euros)
Shares in subsidiaries and affiliates Dec.31, 2012 Additions Disposals Dec.31, 2013
Cost 4,605,759 14 (3,777) 4,601,996
Provisions (105,505) (72,420) 63,661 (114,264)
NET 4,500,254 (72,406) 59,884 4,487,732
The main changes over the financial year are mainly related to the additional depreciation of Cofimines for EUR72million.
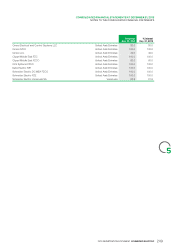
The main investments at December31, 2013 were as follows:
Shares in subsidiaries and affiliates Carrying value
Schneider Electric IndustriesSAS 4,344,481
Cofimines 139,064
Schneider Electric Japan Holding 3,149
Other (less than EUR5million) 1,038
TOTAL 4,487,732
258 2013 REGISTRATION DOCUMENT SCHNEIDER ELECTRIC