APC 2013 Annual Report Download - page 274
Download and view the complete annual report
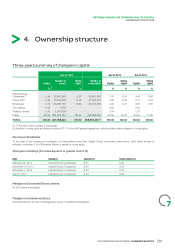
Please find page 274 of the 2013 APC annual report below. You can navigate through the pages in the report by either clicking on the pages listed below, or by using the keyword search tool below to find specific information within the annual report.-
 1
1 -
2
-
3
-
4
-
5
-
6
-
7
-
8
-
9
-
10
-
11
-
12
-
13
-
14
-
15
-
16
-
17
-
18
-
19
-
20
-
21
-
22
-
23
-
24
-
25
-
26
-
27
-
28
-
29
-
30
-
31
-
32
-
33
-
34
-
35
-
36
-
37
-
38
-
39
-
40
-
41
-
42
-
43
-
44
-
45
-
46
-
47
-
48
-
49
-
50
-
51
-
52
-
53
-
54
-
55
-
56
-
57
-
58
-
59
-
60
-
61
-
62
-
63
-
64
-
65
-
66
-
67
-
68
-
69
-
70
-
71
-
72
-
73
-
74
-
75
-
76
-
77
-
78
-
79
-
80
-
81
-
82
-
83
-
84
-
85
-
86
-
87
-
88
-
89
-
90
-
91
-
92
-
93
-
94
-
95
-
96
-
97
-
98
-
99
-
100
-
101
-
102
-
103
-
104
-
105
-
106
-
107
-
108
-
109
-
110
-
111
-
112
-
113
-
114
-
115
-
116
-
117
-
118
-
119
-
120
-
121
-
122
-
123
-
124
-
125
-
126
-
127
-
128
-
129
-
130
-
131
-
132
-
133
-
134
-
135
-
136
-
137
-
138
-
139
-
140
-
141
-
142
-
143
-
144
-
145
-
146
-
147
-
148
-
149
-
150
-
151
-
152
-
153
-
154
-
155
-
156
-
157
-
158
-
159
-
160
-
161
-
162
-
163
-
164
-
165
-
166
-
167
-
168
-
169
-
170
-
171
-
172
-
173
-
174
-
175
-
176
-
177
-
178
-
179
-
180
-
181
-
182
-
183
-
184
-
185
-
186
-
187
-
188
-
189
-
190
-
191
-
192
-
193
-
194
-
195
-
196
-
197
-
198
-
199
-
200
-
201
-
202
-
203
-
204
-
205
-
206
-
207
-
208
-
209
-
210
-
211
-
212
-
213
-
214
-
215
-
216
-
217
-
218
-
219
-
220
-
221
-
222
-
223
-
224
-
225
-
226
-
227
-
228
-
229
-
230
-
231
-
232
-
233
-
234
-
235
-
236
-
237
-
238
-
239
-
240
-
241
-
242
-
243
-
244
-
245
-
246
-
247
-
248
-
249
-
250
-
251
-
252
-
253
-
254
-
255
-
256
-
257
-
258
-
259
-
260
-
261
-
262
-
263
-
 264
264 -
 265
265 -
 266
266 -
 267
267 -
 268
268 -
 269
269 -
 270
270 -
 271
271 -
 272
272 -
 273
273 -
 274
274 -
 275
275 -
 276
276 -
 277
277 -
 278
278 -
 279
279 -
 280
280 -
 281
281 -
 282
282 -
 283
283 -
 284
284 -
285
-
286
-
287
-
288
-
289
-
290
-
291
-
292
-
293
-
294
-
295
-
296
-
297
-
298
-
299
-
300
-
301
-
302
-
303
-
304
-
305
-
306
-
307
-
308
-
309
-
310
-
311
-
312
-
313
-
314
-
315
-
316
-
317
-
318
-
319
-
320
-
321
-
322
-
323
-
324
-
325
-
326
-
327
-
328
-
329
-
330
-
331
-
332
 |
 |

6COMPANY FINANCIALSTATEMENTS
THE COMPANY’S FINANCIAL RESULTS OVER THE LAST FIVE YEARS
The company’s financial results
7.
overthelastfiveyears
Description 2013 2012 2011 2010 2009
Financial position at December31
Share capital (in thousands of euros) 2,247,832 2,221,668 2,195,772 2,175,672 2,102,016
Number of shares in issue 561,958,023 555,417,014 548,943,024 271,959,091 262,752,025
Number of convertible bonds in issue (in thousands)
Maximum number of shares to be created(in thousands):
through conversion of bonds
●
through exercise of rights
●8,794 11,313 15,556 7,478 9,860
Results of operations
(in thousands of euros)
Sales (ex. VAT) 2,194 695 215 2,225 2,419
Investment revenue, interest income and other revenue 135,866 533,420 1,652,422 833,865 723,928
Earnings before tax, depreciation, amortization and
(154,000) 170,417 1,345,453 506,204 393,238provisions
Income tax 91,443 42,875 168,347 9,922 13,244
Earnings after tax, depreciation, amortization and
(132,771) 225,115 2,603,738 702,982 475,753provisions
Dividends paid(1) excluding tax credit and with holdings 1,050,862(2) 1,038,630 933,203 870,269 538,642
Results of operations per share
(in euros)
Earnings before depreciation, amortization
(0,28) 0.50 4.79 2.61 1.71andprovisions
Earnings after tax, depreciation, amortization
(0,24) 0.41 4.74 2.58 1.81andprovisions
Net dividend per share 1.87(2) 1.87 1.70 3.20 2.05
Employees
Average number of employees during the financial year 22222
Total payroll for the financial year
996 1,641 4,549 4,262 3,859(in thousands of euros)
Total of employee benefits paid over the financial year
(Social security, other benefits,etc.) 459 1,963 1,170 3,936 2,004(in thousands of euros)
Dividends on shares held in treasury on the dividend payment date and the associated withholding are credited to retained earnings.(1)
Pending approval by the Annual Shareholders’ Meeting of May6, 2014.(2)
272 2013 REGISTRATION DOCUMENT SCHNEIDER ELECTRIC