APC 2013 Annual Report Download - page 31
Download and view the complete annual report
Please find page 31 of the 2013 APC annual report below. You can navigate through the pages in the report by either clicking on the pages listed below, or by using the keyword search tool below to find specific information within the annual report.-
 1
1 -
2
-
3
-
4
-
5
-
6
-
7
-
8
-
9
-
10
-
11
-
12
-
13
-
14
-
15
-
16
-
17
-
18
-
19
-
20
-
 21
21 -
 22
22 -
 23
23 -
 24
24 -
 25
25 -
 26
26 -
 27
27 -
 28
28 -
 29
29 -
 30
30 -
 31
31 -
 32
32 -
 33
33 -
 34
34 -
 35
35 -
 36
36 -
 37
37 -
 38
38 -
 39
39 -
 40
40 -
 41
41 -
42
-
43
-
44
-
45
-
46
-
47
-
48
-
49
-
50
-
51
-
52
-
53
-
54
-
55
-
56
-
57
-
58
-
59
-
60
-
61
-
62
-
63
-
64
-
65
-
66
-
67
-
68
-
69
-
70
-
71
-
72
-
73
-
74
-
75
-
76
-
77
-
78
-
79
-
80
-
81
-
82
-
83
-
84
-
85
-
86
-
87
-
88
-
89
-
90
-
91
-
92
-
93
-
94
-
95
-
96
-
97
-
98
-
99
-
100
-
101
-
102
-
103
-
104
-
105
-
106
-
107
-
108
-
109
-
110
-
111
-
112
-
113
-
114
-
115
-
116
-
117
-
118
-
119
-
120
-
121
-
122
-
123
-
124
-
125
-
126
-
127
-
128
-
129
-
130
-
131
-
132
-
133
-
134
-
135
-
136
-
137
-
138
-
139
-
140
-
141
-
142
-
143
-
144
-
145
-
146
-
147
-
148
-
149
-
150
-
151
-
152
-
153
-
154
-
155
-
156
-
157
-
158
-
159
-
160
-
161
-
162
-
163
-
164
-
165
-
166
-
167
-
168
-
169
-
170
-
171
-
172
-
173
-
174
-
175
-
176
-
177
-
178
-
179
-
180
-
181
-
182
-
183
-
184
-
185
-
186
-
187
-
188
-
189
-
190
-
191
-
192
-
193
-
194
-
195
-
196
-
197
-
198
-
199
-
200
-
201
-
202
-
203
-
204
-
205
-
206
-
207
-
208
-
209
-
210
-
211
-
212
-
213
-
214
-
215
-
216
-
217
-
218
-
219
-
220
-
221
-
222
-
223
-
224
-
225
-
226
-
227
-
228
-
229
-
230
-
231
-
232
-
233
-
234
-
235
-
236
-
237
-
238
-
239
-
240
-
241
-
242
-
243
-
244
-
245
-
246
-
247
-
248
-
249
-
250
-
251
-
252
-
253
-
254
-
255
-
256
-
257
-
258
-
259
-
260
-
261
-
262
-
263
-
264
-
265
-
266
-
267
-
268
-
269
-
270
-
271
-
272
-
273
-
274
-
275
-
276
-
277
-
278
-
279
-
280
-
281
-
282
-
283
-
284
-
285
-
286
-
287
-
288
-
289
-
290
-
291
-
292
-
293
-
294
-
295
-
296
-
297
-
298
-
299
-
300
-
301
-
302
-
303
-
304
-
305
-
306
-
307
-
308
-
309
-
310
-
311
-
312
-
313
-
314
-
315
-
316
-
317
-
318
-
319
-
320
-
321
-
322
-
323
-
324
-
325
-
326
-
327
-
328
-
329
-
330
-
331
-
332
 |
 |

OVERVIEW OF THE GROUP'S STRATEGY, MARKETS AND BUSINESSES
COMPANY HISTORY AND DEVELOPMENT
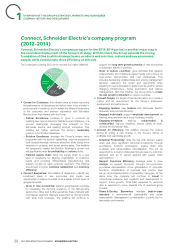
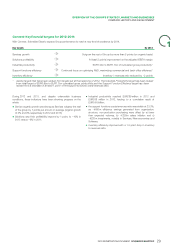
Connect: Key financial targets for2012-2014
1
With Connect, Schneider Electric expects Group performance to reach a new level of excellence by 2014.
Key targets By 2014
Services growth Outgrow the rest of Group by more than 5points (on organic basis)
Solutions profitability At least 2points improvement on the adjusted EBITA margin
Industrial productivity EUR1.0bn to EUR1.1bn of cumulated gross productivity*
Support functions efficiency Continued focus on optimizing R&D, maximizing commercial and back office efficiency*
Inventory efficiency Inventory / revenues ratio reduced by ~2points
denote targets that have been revised from targets set at the beginning of 2012. The Industrial Productivity target has been revised
*
from initial target of EUR0.9bn to EUR1.1bn cumulated gross productivity and the Support Function Efficiency target has been
revised from a decrease of at least 1point of the support functions costs/revenues ratio.
During2012 and 2013, and despite unfavorable business Industrial productivity reached EUR289million in 2012 and
l
conditions, these indicators have been showing progress on the EUR358 million in 2013, leading to a cumulative result of
whole: EUR0.65 billion;
the support functions costs/revenues ratio was stable at 23.3%,
l
Service organic growth was strong as Services outgrew the rest
l
as ~€430m efficiency savings generated from organization,
of the group by 7 points per annum on average (organic growth structure, non-production purchasing were offset by a) lower
of 4% and 9% respectively in 2012 and 2013); than expected volumes, b) ~€230m salary inflation and c)
Solutions saw their profitability improve by 1point, to ~10% in
l
~€220m investments, notably in Services, New economies and
2013 versus ~9% in2011; Software;
inventory efficiency improved with a 1.5 point drop in inventory
l
to revenues ratio.
29
2013 REGISTRATION DOCUMENT SCHNEIDER ELECTRIC