APC 2013 Annual Report Download - page 214
Download and view the complete annual report
Please find page 214 of the 2013 APC annual report below. You can navigate through the pages in the report by either clicking on the pages listed below, or by using the keyword search tool below to find specific information within the annual report.-
 1
1 -
2
-
3
-
4
-
5
-
6
-
7
-
8
-
9
-
10
-
11
-
12
-
13
-
14
-
15
-
16
-
17
-
18
-
19
-
20
-
21
-
22
-
23
-
24
-
25
-
26
-
27
-
28
-
29
-
30
-
31
-
32
-
33
-
34
-
35
-
36
-
37
-
38
-
39
-
40
-
41
-
42
-
43
-
44
-
45
-
46
-
47
-
48
-
49
-
50
-
51
-
52
-
53
-
54
-
55
-
56
-
57
-
58
-
59
-
60
-
61
-
62
-
63
-
64
-
65
-
66
-
67
-
68
-
69
-
70
-
71
-
72
-
73
-
74
-
75
-
76
-
77
-
78
-
79
-
80
-
81
-
82
-
83
-
84
-
85
-
86
-
87
-
88
-
89
-
90
-
91
-
92
-
93
-
94
-
95
-
96
-
97
-
98
-
99
-
100
-
101
-
102
-
103
-
104
-
105
-
106
-
107
-
108
-
109
-
110
-
111
-
112
-
113
-
114
-
115
-
116
-
117
-
118
-
119
-
120
-
121
-
122
-
123
-
124
-
125
-
126
-
127
-
128
-
129
-
130
-
131
-
132
-
133
-
134
-
135
-
136
-
137
-
138
-
139
-
140
-
141
-
142
-
143
-
144
-
145
-
146
-
147
-
148
-
149
-
150
-
151
-
152
-
153
-
154
-
155
-
156
-
157
-
158
-
159
-
160
-
161
-
162
-
163
-
164
-
165
-
166
-
167
-
168
-
169
-
170
-
171
-
172
-
173
-
174
-
175
-
176
-
177
-
178
-
179
-
180
-
181
-
182
-
183
-
184
-
185
-
186
-
187
-
188
-
189
-
190
-
191
-
192
-
193
-
194
-
195
-
196
-
197
-
198
-
199
-
200
-
201
-
202
-
203
-
 204
204 -
 205
205 -
 206
206 -
 207
207 -
 208
208 -
 209
209 -
 210
210 -
 211
211 -
 212
212 -
 213
213 -
 214
214 -
 215
215 -
 216
216 -
 217
217 -
 218
218 -
 219
219 -
 220
220 -
 221
221 -
 222
222 -
 223
223 -
 224
224 -
225
-
226
-
227
-
228
-
229
-
230
-
231
-
232
-
233
-
234
-
235
-
236
-
237
-
238
-
239
-
240
-
241
-
242
-
243
-
244
-
245
-
246
-
247
-
248
-
249
-
250
-
251
-
252
-
253
-
254
-
255
-
256
-
257
-
258
-
259
-
260
-
261
-
262
-
263
-
264
-
265
-
266
-
267
-
268
-
269
-
270
-
271
-
272
-
273
-
274
-
275
-
276
-
277
-
278
-
279
-
280
-
281
-
282
-
283
-
284
-
285
-
286
-
287
-
288
-
289
-
290
-
291
-
292
-
293
-
294
-
295
-
296
-
297
-
298
-
299
-
300
-
301
-
302
-
303
-
304
-
305
-
306
-
307
-
308
-
309
-
310
-
311
-
312
-
313
-
314
-
315
-
316
-
317
-
318
-
319
-
320
-
321
-
322
-
323
-
324
-
325
-
326
-
327
-
328
-
329
-
330
-
331
-
332
 |
 |

5CONSOLIDATED FINANCIALSTATEMENTS ATDECEMBER 31, 2013
NOTES TO THE CONSOLIDATED FINANCIAL STATEMENTS
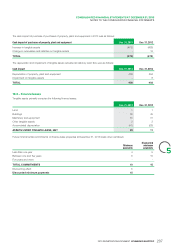
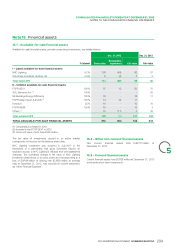
Cash and cash equivalents
Note20
Dec.31, 2013 Dec.31, 2012
Marketable securities 2,193 1,720
Negotiable debt securities and short-term deposits 342 443
Cash and cash equivalents 2,993 1,574
Total cash and cash equivalents 5,528 3,737
Bank overdrafts (140) (120)
NET CASH AND CASH EQUIVALENTS 5,388 3,617
Non-recourse factoring of trade receivables were realized during the second semester of2013 for a total amount of EUR132million,
compared with EUR112million during the second semesterof2012.
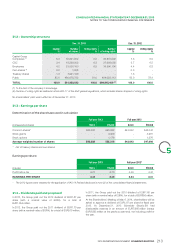
Equity
Note21
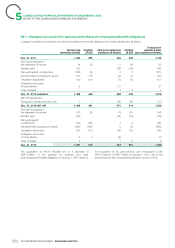
21.1 – Capital
Schneider Electric’s capital management strategy is designed to:
ensure Group liquidity;
l
Share capital
optimize its financial structure;
l
The company’s share capital at December31, 2013 amounted to optimize the weighted average cost of capital.
l
EUR2,247,832,092 represented by 561,958,023shares with a par The strategy must also ensure the Group has access to different
value of EUR4, all fully paid up. capital markets under the best possible conditions. Factors taken
At December31, 2013, a total of 609,815,400voting rights were into account for decision-making purposes include objectives
attached to the 561,958,023shares outstanding. expressed in terms of earnings per share, ratings or balance sheet
stability. Finally, decisions may be implemented depending on
specific market conditions.
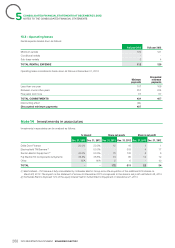
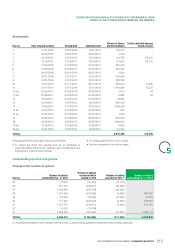
Changes in share capital
Changes in share capital since December31, 2011 were as follows:
Cumulative Total
number of shares (in euros)
Capital at Dec.31, 2011 548,943,024 2,195,772,096
Exercise of stock options 2,952,154 11,808,616
Employee share issue 3,521,836 14,087,344
Capital at Dec.31, 2012 555,417,014 2,221,668,056
Exercise of stock options 3,788,938 15,155,752
Employee share issue 2,752,071 11,008,284
CAPITAL AT DEC.31, 2013 561,958,023 2,247,832,092
The share premium account increased by EUR208,536,503following the exercise of options and the increases in capital.
212 2013 REGISTRATION DOCUMENT SCHNEIDER ELECTRIC