Coca Cola 2010 Annual Report Download - page 109
Download and view the complete annual report
Please find page 109 of the 2010 Coca Cola annual report below. You can navigate through the pages in the report by either clicking on the pages listed below, or by using the keyword search tool below to find specific information within the annual report.-
 1
1 -
2
-
3
-
4
-
5
-
6
-
7
-
8
-
9
-
10
-
11
-
12
-
13
-
14
-
15
-
16
-
17
-
18
-
19
-
20
-
21
-
22
-
23
-
24
-
25
-
26
-
27
-
28
-
29
-
30
-
31
-
32
-
33
-
34
-
35
-
36
-
37
-
38
-
39
-
40
-
41
-
42
-
43
-
44
-
45
-
46
-
47
-
48
-
49
-
50
-
51
-
52
-
53
-
54
-
55
-
56
-
57
-
58
-
59
-
60
-
61
-
62
-
63
-
64
-
65
-
66
-
67
-
68
-
69
-
70
-
71
-
72
-
73
-
74
-
75
-
76
-
77
-
78
-
79
-
80
-
81
-
82
-
83
-
84
-
85
-
86
-
87
-
88
-
89
-
90
-
91
-
92
-
93
-
94
-
95
-
96
-
97
-
98
-
 99
99 -
 100
100 -
 101
101 -
 102
102 -
 103
103 -
 104
104 -
 105
105 -
 106
106 -
 107
107 -
 108
108 -
 109
109 -
 110
110 -
 111
111 -
 112
112 -
 113
113 -
 114
114 -
 115
115 -
 116
116 -
 117
117 -
 118
118 -
 119
119 -
120
-
121
-
122
-
123
-
124
-
125
-
126
-
127
-
128
-
129
-
130
-
131
-
132
-
133
-
134
-
135
-
136
-
137
-
138
-
139
-
140
-
141
-
142
-
143
-
144
-
145
-
146
-
147
-
148
-
149
-
150
-
151
-
152
-
153
-
154
-
155
-
156
-
157
-
158
-
159
-
160
-
161
-
162
-
163
-
164
-
165
-
166
-
167
-
168
-
169
-
170
-
171
-
172
-
173
-
174
-
175
-
176
-
177
-
178
-
179
-
180
-
181
-
182
-
183
-
184
 |
 |

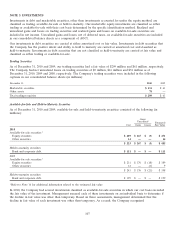
NOTE 3: INVESTMENTS
Investments in debt and marketable securities, other than investments accounted for under the equity method, are
classified as trading, available-for-sale or held-to-maturity. Our marketable equity investments are classified as either
trading or available-for-sale with their cost basis determined by the specific identification method. Realized and
unrealized gains and losses on trading securities and realized gains and losses on available-for-sale securities are
included in net income. Unrealized gains and losses, net of deferred taxes, on available-for-sale securities are included
in our consolidated balance sheets as a component of AOCI.
Our investments in debt securities are carried at either amortized cost or fair value. Investments in debt securities that
the Company has the positive intent and ability to hold to maturity are carried at amortized cost and classified as
held-to-maturity. Investments in debt securities that are not classified as held-to-maturity are carried at fair value and
classified as either trading or available-for-sale.
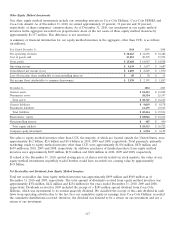
Trading Securities
As of December 31, 2010 and 2009, our trading securities had a fair value of $209 million and $61 million, respectively.
The Company had net unrealized losses on trading securities of $3 million, $16 million and $32 million as of
December 31, 2010, 2009 and 2008, respectively. The Company’s trading securities were included in the following
captions in our consolidated balance sheets (in millions):
December 31, 2010 2009
Marketable securities $ 131 $61
Other assets 78 —
Total trading securities $ 209 $61
Available-for-Sale and Held-to-Maturity Securities
As of December 31, 2010 and 2009, available-for-sale and held-to-maturity securities consisted of the following (in
millions):
Gross
Unrealized Estimated
Cost Gains Losses Fair Value
2010
Available-for-sale securities:1
Equity securities $ 209 $ 267 $ (5) $ 471
Other securities 14 — — 14
$ 223 $ 267 $ (5) $ 485
Held-to-maturity securities:
Bank and corporate debt $ 111 $ — $ — $ 111
2009
Available-for-sale securities:1
Equity securities $ 231 $ 176 $ (18) $ 389
Other securities 12 — (3) 9
$ 243 $ 176 $ (21) $ 398
Held-to-maturity securities:
Bank and corporate debt $ 199 $ — $ — $ 199
1Refer to Note 16 for additional information related to the estimated fair value.
In 2010, the Company had several investments classified as available-for-sale securities in which our cost basis exceeded
the fair value of the investment. Management assessed each of these investments on an individual basis to determine if
the decline in fair value was other than temporary. Based on these assessments, management determined that the
decline in fair value of each investment was other than temporary. As a result, the Company recognized
107