Coca Cola 2010 Annual Report Download - page 46
Download and view the complete annual report
Please find page 46 of the 2010 Coca Cola annual report below. You can navigate through the pages in the report by either clicking on the pages listed below, or by using the keyword search tool below to find specific information within the annual report.-
 1
1 -
2
-
3
-
4
-
5
-
6
-
7
-
8
-
9
-
10
-
11
-
12
-
13
-
14
-
15
-
16
-
17
-
18
-
19
-
20
-
21
-
22
-
23
-
24
-
25
-
26
-
27
-
28
-
29
-
30
-
31
-
32
-
33
-
34
-
35
-
 36
36 -
 37
37 -
 38
38 -
 39
39 -
 40
40 -
 41
41 -
 42
42 -
 43
43 -
 44
44 -
 45
45 -
 46
46 -
 47
47 -
 48
48 -
 49
49 -
 50
50 -
 51
51 -
 52
52 -
 53
53 -
 54
54 -
 55
55 -
 56
56 -
57
-
58
-
59
-
60
-
61
-
62
-
63
-
64
-
65
-
66
-
67
-
68
-
69
-
70
-
71
-
72
-
73
-
74
-
75
-
76
-
77
-
78
-
79
-
80
-
81
-
82
-
83
-
84
-
85
-
86
-
87
-
88
-
89
-
90
-
91
-
92
-
93
-
94
-
95
-
96
-
97
-
98
-
99
-
100
-
101
-
102
-
103
-
104
-
105
-
106
-
107
-
108
-
109
-
110
-
111
-
112
-
113
-
114
-
115
-
116
-
117
-
118
-
119
-
120
-
121
-
122
-
123
-
124
-
125
-
126
-
127
-
128
-
129
-
130
-
131
-
132
-
133
-
134
-
135
-
136
-
137
-
138
-
139
-
140
-
141
-
142
-
143
-
144
-
145
-
146
-
147
-
148
-
149
-
150
-
151
-
152
-
153
-
154
-
155
-
156
-
157
-
158
-
159
-
160
-
161
-
162
-
163
-
164
-
165
-
166
-
167
-
168
-
169
-
170
-
171
-
172
-
173
-
174
-
175
-
176
-
177
-
178
-
179
-
180
-
181
-
182
-
183
-
184
 |
 |

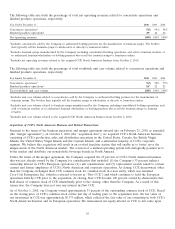
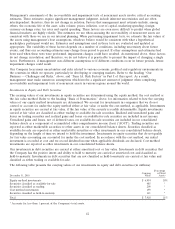
The following table presents the difference between calculated fair values, based on quoted closing prices of publicly
traded shares, and our Company’s cost basis in publicly traded bottlers accounted for as equity method investments (in
millions):
Fair Carrying
December 31, 2010 Value Value Difference
Coca-Cola FEMSA, S.A.B. de C.V. $ 4,740 $ 1,315 $ 3,425
Coca-Cola Amatil Limited 2,322 948 1,374
Coca-Cola Hellenic Bottling Company S.A. 2,204 1,336 868
Coca-Cola Icecek A.S. 692 183 509
Coca-Cola Embonor S.A. 480 284 196
Grupo Continental, S.A.B. 439 175 264
Embotelladoras Coca-Cola Polar S.A. 160 96 64
Coca-Cola Bottling Co. Consolidated 138 83 55
$ 11,175 $ 4,420 $ 6,755
Other Assets
Our Company invests in infrastructure programs with our bottlers that are directed at strengthening our bottling system
and increasing unit case volume. Additionally, our Company advances payments to certain customers to fund future
marketing activities intended to generate profitable volume and expenses such payments over the periods benefited.
Advance payments are also made to certain customers for distribution rights. Payments under these programs are
generally capitalized and reported in the line items prepaid expenses and other assets or other assets, as appropriate, in
our consolidated balance sheets. When facts and circumstances indicate that the carrying value of these assets may not
be recoverable, management assesses the recoverability of the carrying value by preparing estimates of sales volume and
the resulting gross profit and cash flows. These estimated future cash flows are consistent with those we use in our
internal planning. If the sum of the expected future cash flows (undiscounted and without interest charges) is less than
the carrying amount, we recognize an impairment loss. The impairment loss recognized is the amount by which the
carrying amount exceeds the fair value.
In 2010, as a result of our acquisition of CCE’s North American business, the Company recorded a charge of
$265 million related to preexisting relationships. The charge was primarily related to the write-off of our investment in
infrastructure programs with CCE. Our investment in these infrastructure programs with CCE did not meet the criteria
to be recognized as an asset subsequent to the acquisition. Refer to Note 2 and Note 6 of Notes to Consolidated
Financial Statements.
Property, Plant and Equipment
As of December 31, 2010, the carrying value of our property, plant and equipment, net of depreciation, was
approximately $14,727 million, or 20 percent of our total assets. Certain events or changes in circumstances may
indicate that the recoverability of the carrying amount of property, plant and equipment should be assessed, including,
among others, a significant decrease in market value, a significant change in the business climate in a particular market,
or a current period operating or cash flow loss combined with historical losses or projected future losses. When such
events or changes in circumstances are present, we estimate the future cash flows expected to result from the use of the
asset (or asset group) and its eventual disposition. These estimated future cash flows are consistent with those we use in
our internal planning. If the sum of the expected future cash flows (undiscounted and without interest charges) is less
than the carrying amount, we recognize an impairment loss. The impairment loss recognized is the amount by which the
carrying amount exceeds the fair value. We use a variety of methodologies to determine the fair value of property, plant
and equipment, including appraisals and discounted cash flow models, which are consistent with the assumptions we
believe hypothetical marketplace participants would use.
44