Coca Cola 2010 Annual Report Download - page 57
Download and view the complete annual report
Please find page 57 of the 2010 Coca Cola annual report below. You can navigate through the pages in the report by either clicking on the pages listed below, or by using the keyword search tool below to find specific information within the annual report.-
 1
1 -
2
-
3
-
4
-
5
-
6
-
7
-
8
-
9
-
10
-
11
-
12
-
13
-
14
-
15
-
16
-
17
-
18
-
19
-
20
-
21
-
22
-
23
-
24
-
25
-
26
-
27
-
28
-
29
-
30
-
31
-
32
-
33
-
34
-
35
-
36
-
37
-
38
-
39
-
40
-
41
-
42
-
43
-
44
-
45
-
46
-
 47
47 -
 48
48 -
 49
49 -
 50
50 -
 51
51 -
 52
52 -
 53
53 -
 54
54 -
 55
55 -
 56
56 -
 57
57 -
 58
58 -
 59
59 -
 60
60 -
 61
61 -
 62
62 -
 63
63 -
 64
64 -
 65
65 -
 66
66 -
 67
67 -
68
-
69
-
70
-
71
-
72
-
73
-
74
-
75
-
76
-
77
-
78
-
79
-
80
-
81
-
82
-
83
-
84
-
85
-
86
-
87
-
88
-
89
-
90
-
91
-
92
-
93
-
94
-
95
-
96
-
97
-
98
-
99
-
100
-
101
-
102
-
103
-
104
-
105
-
106
-
107
-
108
-
109
-
110
-
111
-
112
-
113
-
114
-
115
-
116
-
117
-
118
-
119
-
120
-
121
-
122
-
123
-
124
-
125
-
126
-
127
-
128
-
129
-
130
-
131
-
132
-
133
-
134
-
135
-
136
-
137
-
138
-
139
-
140
-
141
-
142
-
143
-
144
-
145
-
146
-
147
-
148
-
149
-
150
-
151
-
152
-
153
-
154
-
155
-
156
-
157
-
158
-
159
-
160
-
161
-
162
-
163
-
164
-
165
-
166
-
167
-
168
-
169
-
170
-
171
-
172
-
173
-
174
-
175
-
176
-
177
-
178
-
179
-
180
-
181
-
182
-
183
-
184
 |
 |

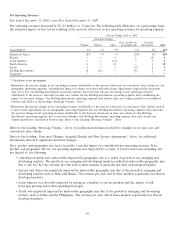
Information about our volume growth by operating segment is as follows:
Percent Change
2010 vs. 2009 2009 vs. 2008
Concentrate Concentrate
Year Ended December 31, Unit Cases1,2 Sales Unit Cases1,2 Sales
Worldwide 5% 5% 3% 3%
Eurasia & Africa 12% 12% 4% 5%
Europe ——(1) (2)
Latin America 5767
North America 22(2) (2)
Pacific 6677
Bottling Investments (1) N/A 2 N/A
1Bottling Investments operating segment data reflects unit case volume growth for consolidated bottlers only.
2Geographic segment data reflects unit case volume growth for all bottlers in the applicable geographic areas, both consolidated and
unconsolidated.
Unit Case Volume
The Coca-Cola system sold approximately 25.5 billion unit cases of our products in 2010, approximately 24.4 billion unit
cases in 2009 and approximately 23.7 billion unit cases in 2008.
Year Ended December 31, 2010, versus Year Ended December 31, 2009
In Eurasia and Africa, unit case volume increased 12 percent, which consisted of 10 percent growth in sparkling
beverages and 21 percent growth in still beverages. The group’s unit case volume growth was primarily attributable to
17 percent growth in India, which included growth of 15 percent and 23 percent in sparkling and still beverages,
respectively. India’s growth in sparkling beverages was led by double-digit growth in Trademarks Sprite, Thums Up and
Coca-Cola, which reflected the benefit of successful national marketing programs. Still beverage growth in India
included the impact of 22 percent growth in our Maaza juice brand. In addition to growth in India, the group’s unit
case volume growth included 14 percent growth in Turkey, 8 percent growth in North and West Africa, 16 percent
growth in Russia, 20 percent growth in Southern Eurasia, 12 percent growth in East and Central Africa and 5 percent
growth in South Africa. The growth across the African continent was attributable to the strong performance of both
sparkling and still beverages and the benefit of our FIFA World Cup activation programs.
Unit case volume in Europe was even, which reflected the impact of continuing difficult macroeconomic conditions
throughout certain regions in Europe. The group’s unit case volume included unit case volume growth of 5 percent in
France, 1 percent in Germany and 2 percent in our Nordic Business Unit. The growth in these regions was offset by
unit case volume declines in other regions, including a 7 percent decline in South and Eastern Europe, primarily due to
continuing macroeconomic pressures. The group’s unit case volume also included unit case volume declines of 2 percent
and 1 percent in Italy and Iberia, respectively.
In Latin America, unit case volume increased 5 percent, which consisted of 4 percent growth in sparkling beverages and
9 percent growth in still beverages. The group’s unit case volume growth was led by 11 percent growth in Brazil and
3 percent growth in Mexico. Brazil’s unit case volume growth was primarily due to 11 percent growth in sparkling
beverages, led by 11 percent growth in Trademark Coca-Cola. Mexico’s unit case volume growth was impacted by
adverse weather conditions. The group’s unit case volume growth also included 5 percent growth in our South Latin
Business Unit. All of the aforementioned markets benefited from our strong FIFA World Cup activation programs.
Unit case volume in North America increased 2 percent, including 1 percent attributable to the new license agreements
with DPS. The group’s unit case volume growth was driven by 5 percent growth in still beverages, led by 19 percent
growth in Trademark Powerade, 12 percent growth in teas and 23 percent growth in Trademark Simply. Unit case
volume for sparkling beverages in North America increased 1 percent, primarily due to the sale of DPS brands under
the new license agreements. Coca-Cola Zero continued its strong performance in North America with 15 percent
55