Coca Cola 2010 Annual Report Download - page 65
Download and view the complete annual report
Please find page 65 of the 2010 Coca Cola annual report below. You can navigate through the pages in the report by either clicking on the pages listed below, or by using the keyword search tool below to find specific information within the annual report.-
 1
1 -
2
-
3
-
4
-
5
-
6
-
7
-
8
-
9
-
10
-
11
-
12
-
13
-
14
-
15
-
16
-
17
-
18
-
19
-
20
-
21
-
22
-
23
-
24
-
25
-
26
-
27
-
28
-
29
-
30
-
31
-
32
-
33
-
34
-
35
-
36
-
37
-
38
-
39
-
40
-
41
-
42
-
43
-
44
-
45
-
46
-
47
-
48
-
49
-
50
-
51
-
52
-
53
-
54
-
 55
55 -
 56
56 -
 57
57 -
 58
58 -
 59
59 -
 60
60 -
 61
61 -
 62
62 -
 63
63 -
 64
64 -
 65
65 -
 66
66 -
 67
67 -
 68
68 -
 69
69 -
 70
70 -
 71
71 -
 72
72 -
 73
73 -
 74
74 -
 75
75 -
76
-
77
-
78
-
79
-
80
-
81
-
82
-
83
-
84
-
85
-
86
-
87
-
88
-
89
-
90
-
91
-
92
-
93
-
94
-
95
-
96
-
97
-
98
-
99
-
100
-
101
-
102
-
103
-
104
-
105
-
106
-
107
-
108
-
109
-
110
-
111
-
112
-
113
-
114
-
115
-
116
-
117
-
118
-
119
-
120
-
121
-
122
-
123
-
124
-
125
-
126
-
127
-
128
-
129
-
130
-
131
-
132
-
133
-
134
-
135
-
136
-
137
-
138
-
139
-
140
-
141
-
142
-
143
-
144
-
145
-
146
-
147
-
148
-
149
-
150
-
151
-
152
-
153
-
154
-
155
-
156
-
157
-
158
-
159
-
160
-
161
-
162
-
163
-
164
-
165
-
166
-
167
-
168
-
169
-
170
-
171
-
172
-
173
-
174
-
175
-
176
-
177
-
178
-
179
-
180
-
181
-
182
-
183
-
184
 |
 |

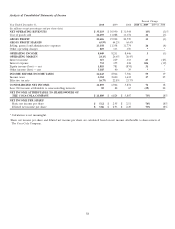
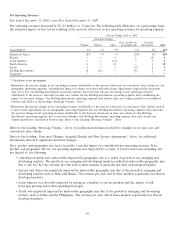
Selling, General and Administrative Expenses
The following table sets forth the significant components of selling, general and administrative expenses (in millions):
Year Ended December 31, 2010 2009 2008
Stock-based compensation expense $ 380 $ 241 $ 266
Advertising expenses 2,917 2,791 2,998
Bottling and distribution expenses 3,902 2,627 2,815
Other operating expenses 5,959 5,699 5,695
Selling, general and administrative expenses $ 13,158 $ 11,358 $ 11,774
Year Ended December 31, 2010, versus Year Ended December 31, 2009
Selling, general and administrative expenses increased by $1,800 million, or 16 percent. Foreign currency fluctuations
increased selling, general and administrative expenses by approximately 1 percent. The increase in stock-based
compensation was primarily related to higher payouts tied to performance in conjunction with our long-term incentive
compensation programs and the impact of modifications made to certain replacement performance share unit awards
issued by the Company in connection with our acquisition of CCE’s North American business. The Company modified
primarily all of these replacement performance share unit awards to eliminate the remaining holding period, which
resulted in approximately $74 million of accelerated expense in the fourth quarter of 2010. Refer to Note 2 of Notes to
Consolidated Financial Statements. The increase in advertising expenses reflected the Company’s continued investment
in our brands and building market execution capabilities.
The increase in bottling and distribution expenses was primarily related to the impact of our acquisition of CCE’s North
American business and our continued investments in our other bottling operations. The unfavorable impact of these
items was partially offset by the deconsolidation of certain entities as a result of the Company’s adoption of new
accounting guidance issued by the FASB. These entities are primarily bottling operations and accounted for
approximately 2 percent of the Company’s consolidated selling, general and administrative expenses in 2009. Bottling
and distribution expenses were also reduced due to the sale of our Norwegian and Swedish bottling operations to New
CCE. Refer to the heading ‘‘Structural Changes, Acquired Brands and New License Agreements,’’ above, for additional
information related to significant structural changes.
In 2011, our pension expense is expected to increase by approximately $60 million compared to 2010. The anticipated
increase is primarily due to the impact of our acquisition of CCE’s North American business and a decrease in our
discount rate compared to 2010. The expected unfavorable impact of these items will be partially offset by the expected
favorable impact of approximately $800 million of anticipated contributions to various plans in 2011, of which
approximately $750 million was contributed in the first quarter of 2011. Approximately half of the anticipated 2011
contributions will be allocated to our primary U.S. pension plans. Refer to the heading ‘‘Liquidity, Capital Resources
and Financial Position’’ for information related to these contributions. Refer to the heading ‘‘Critical Accounting
Policies and Estimates — Pension Plan Valuations,’’ and Note 13 of Notes to Consolidated Financial Statements for
additional information related to the discount rates used by the Company.
As of December 31, 2010, we had $457 million of total unrecognized compensation cost related to nonvested share-
based compensation arrangements granted under our plans. This cost is expected to be recognized over a weighted-
average period of 1.7 years as stock-based compensation expense. This expected cost does not include the impact of any
future stock-based compensation awards. Refer to Note 12 of Notes to Consolidated Financial Statements.
Year Ended December 31, 2009, versus Year Ended December 31, 2008
Selling, general and administrative expenses decreased by $416 million, or 4 percent. The decrease was primarily
attributable to the impact of foreign currency fluctuations, which decreased selling, general and administrative expenses
by approximately 4 percent. Advertising expenses were impacted by shifts in our marketing and media spend strategies,
primarily due to spending more marketing dollars toward in-store activations, loyalty points programs and point-of-sale
marketing. Many of these strategies impact net operating revenues instead of marketing expenses. Refer to the heading
‘‘Net Operating Revenues,’’ above. The decrease in bottling and distribution expenses was primarily attributable to the
full year impact of certain bottling operations sold in 2008. Bottling operations sold in 2008 included Remil and a
63