Coca Cola 2010 Annual Report Download - page 71
Download and view the complete annual report
Please find page 71 of the 2010 Coca Cola annual report below. You can navigate through the pages in the report by either clicking on the pages listed below, or by using the keyword search tool below to find specific information within the annual report.-
 1
1 -
2
-
3
-
4
-
5
-
6
-
7
-
8
-
9
-
10
-
11
-
12
-
13
-
14
-
15
-
16
-
17
-
18
-
19
-
20
-
21
-
22
-
23
-
24
-
25
-
26
-
27
-
28
-
29
-
30
-
31
-
32
-
33
-
34
-
35
-
36
-
37
-
38
-
39
-
40
-
41
-
42
-
43
-
44
-
45
-
46
-
47
-
48
-
49
-
50
-
51
-
52
-
53
-
54
-
55
-
56
-
57
-
58
-
59
-
60
-
 61
61 -
 62
62 -
 63
63 -
 64
64 -
 65
65 -
 66
66 -
 67
67 -
 68
68 -
 69
69 -
 70
70 -
 71
71 -
 72
72 -
 73
73 -
 74
74 -
 75
75 -
 76
76 -
 77
77 -
 78
78 -
 79
79 -
 80
80 -
 81
81 -
82
-
83
-
84
-
85
-
86
-
87
-
88
-
89
-
90
-
91
-
92
-
93
-
94
-
95
-
96
-
97
-
98
-
99
-
100
-
101
-
102
-
103
-
104
-
105
-
106
-
107
-
108
-
109
-
110
-
111
-
112
-
113
-
114
-
115
-
116
-
117
-
118
-
119
-
120
-
121
-
122
-
123
-
124
-
125
-
126
-
127
-
128
-
129
-
130
-
131
-
132
-
133
-
134
-
135
-
136
-
137
-
138
-
139
-
140
-
141
-
142
-
143
-
144
-
145
-
146
-
147
-
148
-
149
-
150
-
151
-
152
-
153
-
154
-
155
-
156
-
157
-
158
-
159
-
160
-
161
-
162
-
163
-
164
-
165
-
166
-
167
-
168
-
169
-
170
-
171
-
172
-
173
-
174
-
175
-
176
-
177
-
178
-
179
-
180
-
181
-
182
-
183
-
184
 |
 |
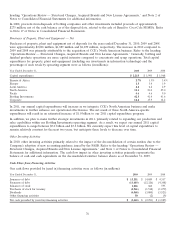
Year Ended December 31, 2009, versus Year Ended December 31, 2008
Interest expense decreased by $83 million, or 19 percent. This decrease was primarily due to lower interest rates on
short-term debt, partially offset by the issuance of long-term debt in the first quarter of 2009. The Company elected to
replace a certain amount of commercial paper and short-term debt with longer-term debt, which resulted in the
Company issuing long-term notes in the principal amounts of $900 million at a rate of 3.625 percent and $1,350 million
at a rate of 4.875 percent due March 15, 2014, and March 15, 2019, respectively. The interest rates on the long-term
notes are higher than the interest rates on our short-term debt. Refer to Note 10 of Notes to Consolidated Financial
Statements.
In addition, interest expense in 2008 included the impact of the reclassification of approximately $17 million of
previously unrecognized gains on interest rate locks from AOCI to interest expense, which was partially offset by
approximately $9 million of losses related to the portion of cash flow hedges that were deemed to be ineffective. The
reclassification was the result of a discontinued cash flow hedging relationship on interest rate locks, as it was no longer
probable that we would issue the long-term debt for which these hedges were designated.
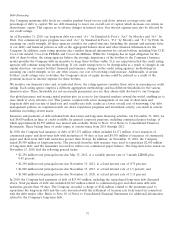
Equity Income (Loss) — Net
Year Ended December 31, 2010, versus Year Ended December 31, 2009
Equity income (loss) — net represents our Company’s proportionate share of net income or loss from each of our
equity method investments. In 2010, equity income was $1,025 million, compared to equity income of $781 million in
2009, an increase of $244 million, or 31 percent. The increase was primarily due to our proportionate share of increased
net income from certain of our equity method investees; the favorable impact of foreign currency exchange fluctuations;
a decrease in the Company’s proportionate share of asset impairments and restructuring charges recorded by equity
method investees; and the impact of the Company’s adoption of new accounting guidance issued by the FASB. The
impact of these items was partially offset by the impact of our acquisition of CCE’s North American business, which
resulted in the consolidation of CCE’s North American business. As a result of this transaction, the Company stopped
recording equity income related to CCE beginning October 2, 2010. Refer to the heading ‘‘Structural Changes,
Acquired Brands and New License Agreements,’’ above.
The Company’s adoption of new accounting guidance issued by the FASB resulted in the deconsolidation of certain
entities. These entities are primarily bottling operations and have been accounted for under the equity method of
accounting since they were deconsolidated on January 1, 2010. Refer to the heading ‘‘Structural Changes, Acquired
Brands and New License Agreements,’’ above. The entities that have been deconsolidated accounted for approximately
4 percent of the Company’s equity income in 2010.
Year Ended December 31, 2009, versus Year Ended December 31, 2008
In 2009, equity income was $781 million, compared to an equity loss of $874 million in 2008, an increase of
$1,655 million. In 2008, equity income (loss) — net was impacted by our proportionate share of approximately
$7.6 billion of pretax charges ($4.9 billion after-tax) recorded by CCE due to impairments of its North American
franchise rights. The Company’s proportionate share of these charges was approximately $1.6 billion. Refer to the
heading ‘‘Critical Accounting Policies and Estimates — Goodwill, Trademarks and Other Intangible Assets,’’ and
Note 17 of Notes to Consolidated Financial Statements. The increase in equity income in 2009 was also partially
attributable to our proportionate share of increased net income from certain of our equity method investees, partially
offset by the unfavorable impact of foreign exchange fluctuations and the Company’s proportionate share of asset
impairments and restructuring charges recorded by equity method investees.
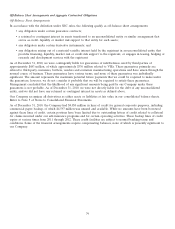
Other Income (Loss) — Net
Other income (loss) — net includes, among other things, the impact of foreign exchange gains and losses, dividend
income, rental income, gains and losses related to the disposal of property, plant and equipment, realized and
unrealized gains and losses on trading securities, realized gains and losses on available-for-sale securities,
other-than-temporary impairments of available-for-sale securities and the accretion of expense related to certain
acquisitions. The foreign currency exchange gains and losses are primarily the result of the remeasurement of monetary
assets and liabilities from certain currencies into functional currencies. The effects of the remeasurement of these assets
69