Coca Cola 2010 Annual Report Download - page 144
Download and view the complete annual report
Please find page 144 of the 2010 Coca Cola annual report below. You can navigate through the pages in the report by either clicking on the pages listed below, or by using the keyword search tool below to find specific information within the annual report.-
 1
1 -
2
-
3
-
4
-
5
-
6
-
7
-
8
-
9
-
10
-
11
-
12
-
13
-
14
-
15
-
16
-
17
-
18
-
19
-
20
-
21
-
22
-
23
-
24
-
25
-
26
-
27
-
28
-
29
-
30
-
31
-
32
-
33
-
34
-
35
-
36
-
37
-
38
-
39
-
40
-
41
-
42
-
43
-
44
-
45
-
46
-
47
-
48
-
49
-
50
-
51
-
52
-
53
-
54
-
55
-
56
-
57
-
58
-
59
-
60
-
61
-
62
-
63
-
64
-
65
-
66
-
67
-
68
-
69
-
70
-
71
-
72
-
73
-
74
-
75
-
76
-
77
-
78
-
79
-
80
-
81
-
82
-
83
-
84
-
85
-
86
-
87
-
88
-
89
-
90
-
91
-
92
-
93
-
94
-
95
-
96
-
97
-
98
-
99
-
100
-
101
-
102
-
103
-
104
-
105
-
106
-
107
-
108
-
109
-
110
-
111
-
112
-
113
-
114
-
115
-
116
-
117
-
118
-
119
-
120
-
121
-
122
-
123
-
124
-
125
-
126
-
127
-
128
-
129
-
130
-
131
-
132
-
133
-
 134
134 -
 135
135 -
 136
136 -
 137
137 -
 138
138 -
 139
139 -
 140
140 -
 141
141 -
 142
142 -
 143
143 -
 144
144 -
 145
145 -
 146
146 -
 147
147 -
 148
148 -
 149
149 -
 150
150 -
 151
151 -
 152
152 -
 153
153 -
 154
154 -
155
-
156
-
157
-
158
-
159
-
160
-
161
-
162
-
163
-
164
-
165
-
166
-
167
-
168
-
169
-
170
-
171
-
172
-
173
-
174
-
175
-
176
-
177
-
178
-
179
-
180
-
181
-
182
-
183
-
184
 |
 |
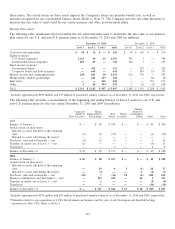
The following tables summarize those assets and liabilities measured at fair value on a recurring basis (in millions):
December 31, 2010
Netting Fair Value
Level 1 Level 2 Level 3 Adjustment1Measurements
Assets
Trading securities $ 183 $ 23 $ 3 $ — $ 209
Available-for-sale securities 480 5 — — 485
Derivatives219 151 4 (143) 31
Total assets $ 682 $ 179 $ 7 $ (143) $ 725
Liabilities
Derivatives2$ 2 $ 382 $ — $ (142) $ 242
Total liabilities $ 2 $ 382 $ — $ (142) $ 242
1Amounts represent the impact of legally enforceable master netting agreements that allow the Company to settle positive and
negative positions and also cash collateral held or placed with the same counterparties.
2Refer to Note 5 for additional information related to the composition of our derivative portfolio.
December 31, 2009
Netting Fair Value
Level 1 Level 2 Level 3 Adjustment1Measurements
Assets
Trading securities $ 50 $ 8 $ 3 $ — $ 61
Available-for-sale securities 393 5 — — 398
Derivatives210 184 2 (108) 88
Total assets $ 453 $ 197 $ 5 $ (108) $ 547
Liabilities
Derivatives2$ 1 $ 110 $ 2 $ (111) $ 2
Total liabilities $ 1 $ 110 $ 2 $ (111) $ 2
1Amounts represent the impact of legally enforceable master netting agreements that allow the Company to settle positive and
negative positions and also cash collateral held or placed with the same counterparties.
2Refer to Note 5 for additional information related to the composition of our derivative portfolio.
Gross realized and unrealized gains and losses on Level 3 assets and liabilities were not significant for the years ended
December 31, 2010 and 2009.
The Company recognizes transfers between levels within the hierarchy as of the beginning of the reporting period. Gross
transfers between levels within the hierarchy were not significant for the years ended December 31, 2010 and 2009.
142