Coca Cola 2010 Annual Report Download - page 64
Download and view the complete annual report
Please find page 64 of the 2010 Coca Cola annual report below. You can navigate through the pages in the report by either clicking on the pages listed below, or by using the keyword search tool below to find specific information within the annual report.-
 1
1 -
2
-
3
-
4
-
5
-
6
-
7
-
8
-
9
-
10
-
11
-
12
-
13
-
14
-
15
-
16
-
17
-
18
-
19
-
20
-
21
-
22
-
23
-
24
-
25
-
26
-
27
-
28
-
29
-
30
-
31
-
32
-
33
-
34
-
35
-
36
-
37
-
38
-
39
-
40
-
41
-
42
-
43
-
44
-
45
-
46
-
47
-
48
-
49
-
50
-
51
-
52
-
53
-
 54
54 -
 55
55 -
 56
56 -
 57
57 -
 58
58 -
 59
59 -
 60
60 -
 61
61 -
 62
62 -
 63
63 -
 64
64 -
 65
65 -
 66
66 -
 67
67 -
 68
68 -
 69
69 -
 70
70 -
 71
71 -
 72
72 -
 73
73 -
 74
74 -
75
-
76
-
77
-
78
-
79
-
80
-
81
-
82
-
83
-
84
-
85
-
86
-
87
-
88
-
89
-
90
-
91
-
92
-
93
-
94
-
95
-
96
-
97
-
98
-
99
-
100
-
101
-
102
-
103
-
104
-
105
-
106
-
107
-
108
-
109
-
110
-
111
-
112
-
113
-
114
-
115
-
116
-
117
-
118
-
119
-
120
-
121
-
122
-
123
-
124
-
125
-
126
-
127
-
128
-
129
-
130
-
131
-
132
-
133
-
134
-
135
-
136
-
137
-
138
-
139
-
140
-
141
-
142
-
143
-
144
-
145
-
146
-
147
-
148
-
149
-
150
-
151
-
152
-
153
-
154
-
155
-
156
-
157
-
158
-
159
-
160
-
161
-
162
-
163
-
164
-
165
-
166
-
167
-
168
-
169
-
170
-
171
-
172
-
173
-
174
-
175
-
176
-
177
-
178
-
179
-
180
-
181
-
182
-
183
-
184
 |
 |
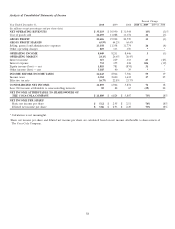
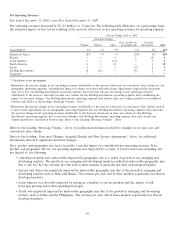
Gross Profit Margin
Year Ended December 31, 2010, versus Year Ended December 31, 2009
Our gross profit margin decreased to 63.9 percent from 64.2 percent. The decrease was primarily due to the impact of
our acquisition of CCE’s North American business, partially offset by favorable geographic mix, product mix, the sale of
our Norwegian and Swedish bottling operations and the deconsolidation of certain entities as a result of the Company’s
adoption of new accounting guidance issued by the FASB.
Refer to the heading ‘‘Structural Changes, Acquired Brands and New License Agreements,’’ above, for additional
information regarding the impact of our acquisition of CCE’s North American business, the sale of our Norwegian and
Swedish bottling operations and the deconsolidation of certain entities as a result of the Company’s adoption of new
accounting guidance issued by the FASB. The favorable geographic mix was primarily due to many of our emerging
markets recovering from the global recession at a quicker pace than our developed markets. Although this shift in
geographic mix has a negative impact on net operating revenues, it generally has a favorable impact on our gross profit
margin due to the correlated impact it has on our product mix. The product mix in the majority of our emerging and
developing markets is more heavily skewed toward our sparkling beverage products, which generally yield a higher gross
profit margin compared to our still beverages and finished products. Refer to the heading ‘‘Net Operating Revenues,’’
above.
In 2011, we expect our gross profit margin to decline due to the full year impact of consolidating CCE’s North
American business, as well as an increase in commodity costs. The acquisition of CCE’s North American business has
resulted in a significant adjustment to our overall cost structure, especially in North America. Finished products
operations typically have lower gross profit margins and the additional commodity risk could lead to higher raw
material costs in 2011. Subsequent to this transaction, approximately 35 percent of our consolidated cost of goods sold
is comprised of the raw material and conversion cost associated with the following inputs: (1) sweeteners, (2) metals,
(3) juices and (4) PET. The majority of these costs are incurred by our North America and Bottling Investments
operating segments. We anticipate that the cost of underlying commodities related to these inputs will continue to face
upward pressure. We expect the full year 2011 impact of increased commodity costs on our total company results to
range between $300 million and $400 million.
Upon the close of our acquisition of CCE’s North American business, we increased our hedging activities related to
certain commodities in order to mitigate a portion of the price risk associated with forecasted purchases. Many of the
derivative financial instruments used by the Company to mitigate the risk associated with these commodity exposures do
not qualify for hedge accounting. As a result, the change in fair value of these derivative instruments will be included as
a component of net income each reporting period. Refer to Note 5 of Notes to Consolidated Financial Statements.
Year Ended December 31, 2009, versus Year Ended December 31, 2008
Our gross profit margin decreased to 64.2 percent in 2009 from 64.4 percent in 2008, primarily due to foreign currency
fluctuations, the growth of our finished products operations, unfavorable geographic mix as a result of growth in our
emerging and developing markets, our current focus to drive greater affordability initiatives across many key markets,
and unfavorable channel and product mix in certain key markets. The unfavorable impact of the previously mentioned
items was partially offset by the favorable impact of price increases in certain markets, lower costs related to several key
commodities and the sale of certain bottling operations in 2008. Generally, bottling and finished products operations
produce higher net operating revenues but lower gross profit margins compared to concentrate and syrup operations.
Bottling operations sold in 2008 included Remil and a portion of our ownership interest in Coca-Cola Pakistan, which
resulted in its deconsolidation. Refer to the heading ‘‘Other Income (Loss) — Net,’’ below, and Note 17 of Notes to
Consolidated Financial Statements.
62