Coca Cola 2010 Annual Report Download - page 78
Download and view the complete annual report
Please find page 78 of the 2010 Coca Cola annual report below. You can navigate through the pages in the report by either clicking on the pages listed below, or by using the keyword search tool below to find specific information within the annual report.-
 1
1 -
2
-
3
-
4
-
5
-
6
-
7
-
8
-
9
-
10
-
11
-
12
-
13
-
14
-
15
-
16
-
17
-
18
-
19
-
20
-
21
-
22
-
23
-
24
-
25
-
26
-
27
-
28
-
29
-
30
-
31
-
32
-
33
-
34
-
35
-
36
-
37
-
38
-
39
-
40
-
41
-
42
-
43
-
44
-
45
-
46
-
47
-
48
-
49
-
50
-
51
-
52
-
53
-
54
-
55
-
56
-
57
-
58
-
59
-
60
-
61
-
62
-
63
-
64
-
65
-
66
-
67
-
 68
68 -
 69
69 -
 70
70 -
 71
71 -
 72
72 -
 73
73 -
 74
74 -
 75
75 -
 76
76 -
 77
77 -
 78
78 -
 79
79 -
 80
80 -
 81
81 -
 82
82 -
 83
83 -
 84
84 -
 85
85 -
 86
86 -
 87
87 -
 88
88 -
89
-
90
-
91
-
92
-
93
-
94
-
95
-
96
-
97
-
98
-
99
-
100
-
101
-
102
-
103
-
104
-
105
-
106
-
107
-
108
-
109
-
110
-
111
-
112
-
113
-
114
-
115
-
116
-
117
-
118
-
119
-
120
-
121
-
122
-
123
-
124
-
125
-
126
-
127
-
128
-
129
-
130
-
131
-
132
-
133
-
134
-
135
-
136
-
137
-
138
-
139
-
140
-
141
-
142
-
143
-
144
-
145
-
146
-
147
-
148
-
149
-
150
-
151
-
152
-
153
-
154
-
155
-
156
-
157
-
158
-
159
-
160
-
161
-
162
-
163
-
164
-
165
-
166
-
167
-
168
-
169
-
170
-
171
-
172
-
173
-
174
-
175
-
176
-
177
-
178
-
179
-
180
-
181
-
182
-
183
-
184
 |
 |

heading ‘‘Operations Review — Structural Changes, Acquired Brands and New License Agreements,’’ and Note 2 of
Notes to Consolidated Financial Statements for additional information.
In 2008, proceeds from disposals of bottling companies and other investments included proceeds of approximately
$275 million, net of the cash balance as of the disposal date, related to the sale of Remil to Coca-Cola FEMSA. Refer
to Note 17 of Notes to Consolidated Financial Statements.
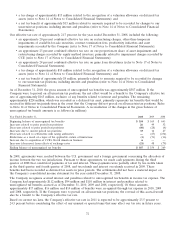
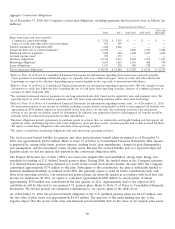
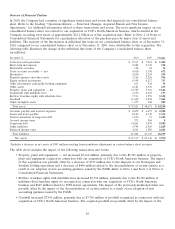
Purchases of Property, Plant and Equipment — Net
Purchases of property, plant and equipment net of disposals for the years ended December 31, 2010, 2009 and 2008
were approximately $2,081 million, $1,889 million and $1,839 million, respectively. The increase in 2010 compared to
2009 and 2008 was primarily attributable to the acquisition of CCE’s North American business. Refer to the heading
‘‘Operations Review — Structural Changes, Acquired Brands and New License Agreements.’’ Generally, bottling and
finished products operations are more capital intensive compared to concentrate and syrup operations. Total capital
expenditures for property, plant and equipment (including our investments in information technology) and the
percentage of such totals by operating segment were as follows (in millions):
Year Ended December 31, 2010 2009 2008
Capital expenditures $ 2,215 $ 1,993 $ 1,968
Eurasia & Africa 2.7% 3.5% 3.4%
Europe 1.5 3.4 3.9
Latin America 4.2 6.2 2.9
North America 32.1 23.0 25.0
Pacific 4.6 4.6 9.0
Bottling Investments 42.5 41.4 41.6
Corporate 12.4 17.9 14.2
In 2011, our annual capital expenditures will increase as we integrate CCE’s North American business and make
investments to further enhance our operational effectiveness. The net result of these North America-specific
expenditures will result in an estimated increase of $1.0 billion to our 2011 capital expenditure program.
In addition, we plan to make further strategic investments in 2011, primarily related to expanding our production and
sales capabilities within our Bottling Investments operating segment. As a result, we expect our annual 2011 capital
expenditures to range between $3.0 billion and $3.2 billion. We currently expect this level of capital expenditure to
remain relatively constant for the next two years, but anticipate these levels to decrease over time.
Other Investing Activities
In 2010, other investing activities primarily related to the impact of the deconsolidation of certain entities due to the
Company’s adoption of new accounting guidance issued by the FASB. Refer to the heading ‘‘Operations Review —
Structural Changes, Acquired Brands and New License Agreements,’’ and Note 1 of Notes to Consolidated Financial
Statements for additional information. The cash flow impact in other investing activities primarily represents the
balance of cash and cash equivalents on the deconsolidated entities’ balance sheets as of December 31, 2009.
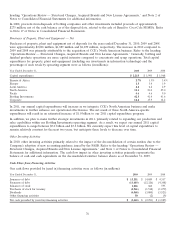
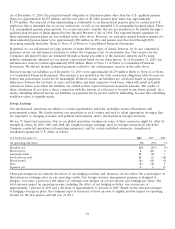
Cash Flows from Financing Activities
Our cash flows provided by (used in) financing activities were as follows (in millions):
Year Ended December 31, 2010 2009 2008
Issuances of debt $ 15,251 $ 14,689 $ 4,337
Payments of debt (13,403) (12,326) (4,308)
Issuances of stock 1,666 664 595
Purchases of stock for treasury (2,961) (1,518) (1,079)
Dividends (4,068) (3,800) (3,521)
Other financing activities 50 (2) (9)
Net cash provided by (used in) financing activities $ (3,465) $ (2,293) $ (3,985)
76