Coca Cola 2010 Annual Report Download - page 134
Download and view the complete annual report
Please find page 134 of the 2010 Coca Cola annual report below. You can navigate through the pages in the report by either clicking on the pages listed below, or by using the keyword search tool below to find specific information within the annual report.-
 1
1 -
2
-
3
-
4
-
5
-
6
-
7
-
8
-
9
-
10
-
11
-
12
-
13
-
14
-
15
-
16
-
17
-
18
-
19
-
20
-
21
-
22
-
23
-
24
-
25
-
26
-
27
-
28
-
29
-
30
-
31
-
32
-
33
-
34
-
35
-
36
-
37
-
38
-
39
-
40
-
41
-
42
-
43
-
44
-
45
-
46
-
47
-
48
-
49
-
50
-
51
-
52
-
53
-
54
-
55
-
56
-
57
-
58
-
59
-
60
-
61
-
62
-
63
-
64
-
65
-
66
-
67
-
68
-
69
-
70
-
71
-
72
-
73
-
74
-
75
-
76
-
77
-
78
-
79
-
80
-
81
-
82
-
83
-
84
-
85
-
86
-
87
-
88
-
89
-
90
-
91
-
92
-
93
-
94
-
95
-
96
-
97
-
98
-
99
-
100
-
101
-
102
-
103
-
104
-
105
-
106
-
107
-
108
-
109
-
110
-
111
-
112
-
113
-
114
-
115
-
116
-
117
-
118
-
119
-
120
-
121
-
122
-
123
-
 124
124 -
 125
125 -
 126
126 -
 127
127 -
 128
128 -
 129
129 -
 130
130 -
 131
131 -
 132
132 -
 133
133 -
 134
134 -
 135
135 -
 136
136 -
 137
137 -
 138
138 -
 139
139 -
 140
140 -
 141
141 -
 142
142 -
 143
143 -
 144
144 -
145
-
146
-
147
-
148
-
149
-
150
-
151
-
152
-
153
-
154
-
155
-
156
-
157
-
158
-
159
-
160
-
161
-
162
-
163
-
164
-
165
-
166
-
167
-
168
-
169
-
170
-
171
-
172
-
173
-
174
-
175
-
176
-
177
-
178
-
179
-
180
-
181
-
182
-
183
-
184
 |
 |

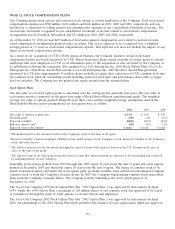
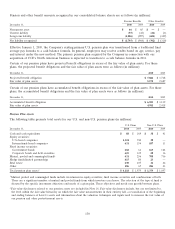
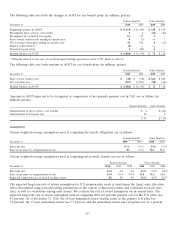
Investment Strategy for Non-U.S. Pension Plans
Approximately 50 percent of our international subsidiaries’ pension plan assets are invested in mutual, pooled and
commingled funds. As of December 31, 2010, mutual, pooled and commingled funds were composed of approximately
51 percent pooled equity securities, 28 percent pooled fixed income securities and 21 percent mutual and commingled
funds. The investment strategies of our international subsidiaries differ greatly, and in some instances are influenced by
local law. None of our pension plans outside the United States is individually significant for separate disclosure.
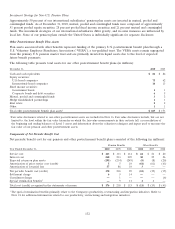
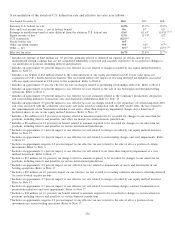
Other Postretirement Benefit Plan Assets
Plan assets associated with other benefits represent funding of the primary U.S. postretirement benefit plan through a
U.S. Voluntary Employee Beneficiary Association (‘‘VEBA’’), a tax-qualified trust. The VEBA assets remain segregated
from the primary U.S. pension master trust and are primarily invested in liquid assets due to the level of expected
future benefit payments.
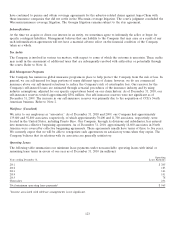
The following table presents total assets for our other postretirement benefit plans (in millions):
December 31, 2010 2009
Cash and cash equivalents $84 $86
Equity securities:
U.S.-based companies 75 62
International-based companies 14 13
Fixed income securities:
Government bonds 11
Corporate bonds and debt securities 65
Mutual, pooled and commingled funds 32
Hedge funds/limited partnerships 11
Real estate 22
Other 11
Total other postretirement benefit plan assets1$ 187 $ 173
1Fair value disclosures related to our other postretirement assets are included in Note 16. Fair value disclosures include, but are not
limited to, the level within the fair value hierarchy on which the fair value measurements in their entirety fall, a reconciliation of
the beginning and ending balances of Level 3 assets and information about the valuation techniques and inputs used to measure the
fair value of our pension and other postretirement assets.
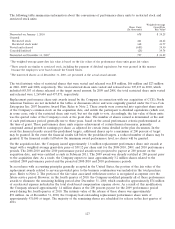
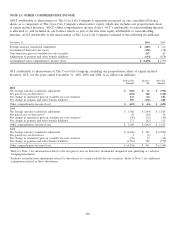
Components of Net Periodic Benefit Cost
Net periodic benefit cost for our pension and other postretirement benefit plans consisted of the following (in millions):
Pension Benefits Other Benefits
Year Ended December 31, 2010 2009 2008 2010 2009 2008
Service cost $ 143 $ 113 $ 114 $24 $21 $20
Interest cost 260 213 205 30 29 26
Expected return on plan assets (295) (214) (249) (8) (8) (20)
Amortization of prior service cost (credit) 5510(61) (61) (61)
Amortization of actuarial loss 57 86 10 3——
Net periodic benefit cost (credit) 170 203 90 (12) (19) (35)
Settlement charge 6514———
Curtailment charge —1———(6)
Special termination benefits1—911 14—
Total cost (credit) recognized in the statements of income $ 176 $ 218 $ 115 $ (11) $ (15) $ (41)
1The special termination benefits primarily relate to the Company’s productivity, restructuring and integration initiatives. Refer to
Note 18 for additional information related to our productivity, restructuring and integration initiatives.
132