Coca Cola 2010 Annual Report Download - page 146
Download and view the complete annual report
Please find page 146 of the 2010 Coca Cola annual report below. You can navigate through the pages in the report by either clicking on the pages listed below, or by using the keyword search tool below to find specific information within the annual report.-
 1
1 -
2
-
3
-
4
-
5
-
6
-
7
-
8
-
9
-
10
-
11
-
12
-
13
-
14
-
15
-
16
-
17
-
18
-
19
-
20
-
21
-
22
-
23
-
24
-
25
-
26
-
27
-
28
-
29
-
30
-
31
-
32
-
33
-
34
-
35
-
36
-
37
-
38
-
39
-
40
-
41
-
42
-
43
-
44
-
45
-
46
-
47
-
48
-
49
-
50
-
51
-
52
-
53
-
54
-
55
-
56
-
57
-
58
-
59
-
60
-
61
-
62
-
63
-
64
-
65
-
66
-
67
-
68
-
69
-
70
-
71
-
72
-
73
-
74
-
75
-
76
-
77
-
78
-
79
-
80
-
81
-
82
-
83
-
84
-
85
-
86
-
87
-
88
-
89
-
90
-
91
-
92
-
93
-
94
-
95
-
96
-
97
-
98
-
99
-
100
-
101
-
102
-
103
-
104
-
105
-
106
-
107
-
108
-
109
-
110
-
111
-
112
-
113
-
114
-
115
-
116
-
117
-
118
-
119
-
120
-
121
-
122
-
123
-
124
-
125
-
126
-
127
-
128
-
129
-
130
-
131
-
132
-
133
-
134
-
135
-
 136
136 -
 137
137 -
 138
138 -
 139
139 -
 140
140 -
 141
141 -
 142
142 -
 143
143 -
 144
144 -
 145
145 -
 146
146 -
 147
147 -
 148
148 -
 149
149 -
 150
150 -
 151
151 -
 152
152 -
 153
153 -
 154
154 -
 155
155 -
 156
156 -
157
-
158
-
159
-
160
-
161
-
162
-
163
-
164
-
165
-
166
-
167
-
168
-
169
-
170
-
171
-
172
-
173
-
174
-
175
-
176
-
177
-
178
-
179
-
180
-
181
-
182
-
183
-
184
 |
 |

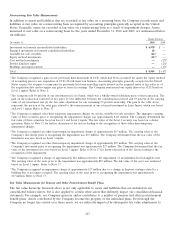
these assets. The actual return on these assets impacts the Company’s future net periodic benefit cost, as well as
amounts recognized in our consolidated balance sheets. Refer to Note 13. The Company uses the fair value hierarchy to
measure the fair value of assets held by our various pension and other postretirement plans.
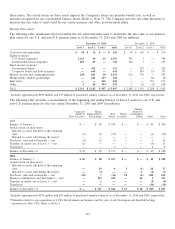
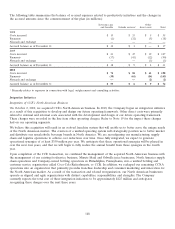
Pension Plan Assets
The following table summarizes the level within the fair value hierarchy used to determine the fair value of our pension
plan assets for our U.S. and non-U.S. pension plans as of December 31, 2010 and 2009 (in millions):
December 31, 2010 December 31, 2009
Level 1 Level 2 Level 3 Total Level 1 Level 2 Level 3 Total
Cash and cash equivalents $ 50$ 76 $—$ 126 $ 49 $ 161 $ — $ 210
Equity securities:
U.S.-based companies 1,325 14 15 1,354 741 3 — 744
International-based companies 689 49 — 738 164 1 — 165
Fixed income securities:
Government bonds — 431 — 431 — 225 — 225
Corporate bonds and debt securities — 645 — 645 — 345 10 355
Mutual, pooled and commingled funds 248 863 20 1,131 233 759 — 992
Hedge funds / limited partnerships — 121 317 438 — — 80 80
Real estate — — 242 242 — — 153 153
Other 3 86 3031392 16245
1108
Total $ 2,315 $ 2,285 $ 897 $ 5,497 $ 1,188 $ 1,556 $ 288 $ 3,032
1Includes approximately $299 million and $39 million of purchased annuity contracts as of December 31, 2010 and 2009, respectively.
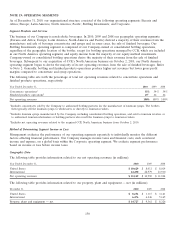
The following table provides a reconciliation of the beginning and ending balance of Level 3 assets for our U.S. and
non-U.S. pension plans for the year ended December 31, 2010 and 2009 (in millions):
Mutual,
Corporate Hedge Pooled &
Bonds & Funds/Limited Real Equity Commingled
Debt Securities Partnerships Estate Securities Funds Other Total
2009
Balance at January 1 $ — $ 58 $ 198 $ — $ — $ 44 $ 300
Actual return on plan assets:
Related to assets still held at the reporting
date (1) 10 (57) — — (1) (49)
Related to assets sold during the period — — — — — — —
Purchases, sales and settlements — net (5) 12 6 — — 5 18
Transfers in and/or out of Level 3 — net 16 — — — — (5) 11
Translation — — 6 — — 2 8
Balance at December 31 $ 10 $ 80 $ 153 $ — $ — $ 451$ 288
2010
Balance at January 1 $ 10 $ 80 $ 153 $ — $ — $ 45 $ 288
Actual return on plan assets:
Related to assets still held at the reporting
date — 19 4 5 (1) 10 37
Related to assets sold during the period — (3) — — 1 (1) (3)
Purchases, sales and settlements — net (10) 7 (36) 10 (4) 288 255
Business combinations and divestitures — net2— 213 121 — 24 5 363
Transfers in and/or out of Level 3 — net — 1 — — — (5) (4)
Translation — — — — — (39) (39)
Balance at December 31 $ — $ 317 $ 242 $ 15 $ 20 $ 3031$ 897
1Includes approximately $299 million and $39 million of purchased annuity contracts as of December 31, 2010 and 2009, respectively.
2Primarily related to our acquisition of CCE’s North American business and the sale of our Norwegian and Swedish bottling
operations to New CCE. Refer to Note 2.
144