Coca Cola 2010 Annual Report Download - page 99
Download and view the complete annual report
Please find page 99 of the 2010 Coca Cola annual report below. You can navigate through the pages in the report by either clicking on the pages listed below, or by using the keyword search tool below to find specific information within the annual report.-
 1
1 -
2
-
3
-
4
-
5
-
6
-
7
-
8
-
9
-
10
-
11
-
12
-
13
-
14
-
15
-
16
-
17
-
18
-
19
-
20
-
21
-
22
-
23
-
24
-
25
-
26
-
27
-
28
-
29
-
30
-
31
-
32
-
33
-
34
-
35
-
36
-
37
-
38
-
39
-
40
-
41
-
42
-
43
-
44
-
45
-
46
-
47
-
48
-
49
-
50
-
51
-
52
-
53
-
54
-
55
-
56
-
57
-
58
-
59
-
60
-
61
-
62
-
63
-
64
-
65
-
66
-
67
-
68
-
69
-
70
-
71
-
72
-
73
-
74
-
75
-
76
-
77
-
78
-
79
-
80
-
81
-
82
-
83
-
84
-
85
-
86
-
87
-
88
-
 89
89 -
 90
90 -
 91
91 -
 92
92 -
 93
93 -
 94
94 -
 95
95 -
 96
96 -
 97
97 -
 98
98 -
 99
99 -
 100
100 -
 101
101 -
 102
102 -
 103
103 -
 104
104 -
 105
105 -
 106
106 -
 107
107 -
 108
108 -
 109
109 -
110
-
111
-
112
-
113
-
114
-
115
-
116
-
117
-
118
-
119
-
120
-
121
-
122
-
123
-
124
-
125
-
126
-
127
-
128
-
129
-
130
-
131
-
132
-
133
-
134
-
135
-
136
-
137
-
138
-
139
-
140
-
141
-
142
-
143
-
144
-
145
-
146
-
147
-
148
-
149
-
150
-
151
-
152
-
153
-
154
-
155
-
156
-
157
-
158
-
159
-
160
-
161
-
162
-
163
-
164
-
165
-
166
-
167
-
168
-
169
-
170
-
171
-
172
-
173
-
174
-
175
-
176
-
177
-
178
-
179
-
180
-
181
-
182
-
183
-
184
 |
 |

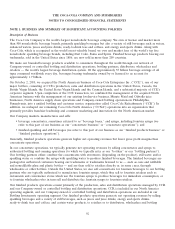
of sales proceeds and appraisals, as appropriate. We consider the assumptions that we believe hypothetical marketplace
participants would use in evaluating estimated future cash flows when employing the discounted cash flow or estimates
of sales proceeds valuation methodologies.
In the event the fair value of an investment declines below our cost basis, management determines if the decline in fair
value is other than temporary. If management determines the decline is other than temporary, an impairment charge is
recorded. Management’s assessment as to the nature of a decline in fair value is based on, among other things, the
length of time and the extent to which the market value has been less than our cost basis, the financial condition and
near-term prospects of the issuer, and our intent and ability to retain the investment for a period of time sufficient to
allow for any anticipated recovery in market value.
Trade Accounts Receivable
We record trade accounts receivable at net realizable value. This value includes an appropriate allowance for estimated
uncollectible accounts to reflect any loss anticipated on the trade accounts receivable balances and charged to the
provision for doubtful accounts. We calculate this allowance based on our history of write-offs, the level of past-due
accounts based on the contractual terms of the receivables, and our relationships with, and the economic status of, our
bottling partners and customers. We believe our exposure to concentrations of credit risk is limited due to the diverse
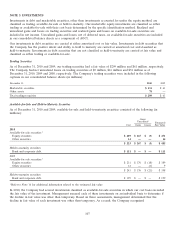
geographic areas covered by our operations. Activity in the allowance for doubtful accounts was as follows (in millions):
Year Ended December 31, 2010 2009 2008
Balance, beginning of year $55 $51 $56
Net charges to costs and expenses 21 24 17
Write-offs (18) (22) (28)
Other1(10) 26
Balance, end of year $48 $55 $51
1 Other includes acquisitions, divestitures and currency translation.
A significant portion of our net operating revenues and corresponding accounts receivable is derived from sales of our
products in international markets. Refer to Note 19. We also generate a significant portion of our net operating
revenues by selling concentrates and syrups to bottlers in which we have a noncontrolling interest, including Coca-Cola
Hellenic Bottling Company S.A. (‘‘Coca-Cola Hellenic’’), Coca-Cola FEMSA, S.A.B. de C.V. (‘‘Coca-Cola FEMSA’’)
and Coca-Cola Amatil Limited (‘‘Coca-Cola Amatil’’). Refer to Note 6.
Inventories
Inventories consist primarily of raw materials and packaging (which includes ingredients and supplies) and finished
goods (which include concentrates and syrups in our concentrate operations, and finished beverages in our finished
products operations). Inventories are valued at the lower of cost or market. We determine cost on the basis of the
average cost or first-in, first-out methods. Refer to Note 4.
Derivative Instruments
Our Company, when deemed appropriate, uses derivatives as a risk management tool to mitigate the potential impact
of certain market risks. The primary market risks managed by the Company through the use of derivative instruments
are foreign currency exchange rate risk, commodity price risk and interest rate risk. All derivatives are carried at fair
value in the consolidated balance sheets in the line items prepaid expenses and other assets or accounts payable and
accrued expenses, as applicable. Refer to Note 5.
Property, Plant and Equipment
Property, plant and equipment are stated at cost. Repair and maintenance costs that do not improve service potential or
extend economic life are expensed as incurred. Depreciation is recorded principally by the straight-line method over the
estimated useful lives of our assets, which generally have the following ranges: buildings and improvements: 40 years or
less; machinery, equipment and vehicle fleet: 20 years or less; cold-drink equipment: 13 years or less; and containers:
12 years or less. Land is not depreciated, and construction in progress is not depreciated until ready for service.
Leasehold improvements are amortized using the straight-line method over the shorter of the remaining lease term,
including renewals that are deemed to be reasonably assured, or the estimated useful life of the improvement.
Depreciation expense, including the depreciation expense of assets under capital lease, totaled $1,188 million,
$1,005 million and $993 million in 2010, 2009 and 2008, respectively. Amortization expense for leasehold improvements
totaled $16 million, $18 million and $19 million in 2010, 2009 and 2008, respectively.
97