Coca Cola 2010 Annual Report Download - page 61
Download and view the complete annual report
Please find page 61 of the 2010 Coca Cola annual report below. You can navigate through the pages in the report by either clicking on the pages listed below, or by using the keyword search tool below to find specific information within the annual report.-
 1
1 -
2
-
3
-
4
-
5
-
6
-
7
-
8
-
9
-
10
-
11
-
12
-
13
-
14
-
15
-
16
-
17
-
18
-
19
-
20
-
21
-
22
-
23
-
24
-
25
-
26
-
27
-
28
-
29
-
30
-
31
-
32
-
33
-
34
-
35
-
36
-
37
-
38
-
39
-
40
-
41
-
42
-
43
-
44
-
45
-
46
-
47
-
48
-
49
-
50
-
 51
51 -
 52
52 -
 53
53 -
 54
54 -
 55
55 -
 56
56 -
 57
57 -
 58
58 -
 59
59 -
 60
60 -
 61
61 -
 62
62 -
 63
63 -
 64
64 -
 65
65 -
 66
66 -
 67
67 -
 68
68 -
 69
69 -
 70
70 -
 71
71 -
72
-
73
-
74
-
75
-
76
-
77
-
78
-
79
-
80
-
81
-
82
-
83
-
84
-
85
-
86
-
87
-
88
-
89
-
90
-
91
-
92
-
93
-
94
-
95
-
96
-
97
-
98
-
99
-
100
-
101
-
102
-
103
-
104
-
105
-
106
-
107
-
108
-
109
-
110
-
111
-
112
-
113
-
114
-
115
-
116
-
117
-
118
-
119
-
120
-
121
-
122
-
123
-
124
-
125
-
126
-
127
-
128
-
129
-
130
-
131
-
132
-
133
-
134
-
135
-
136
-
137
-
138
-
139
-
140
-
141
-
142
-
143
-
144
-
145
-
146
-
147
-
148
-
149
-
150
-
151
-
152
-
153
-
154
-
155
-
156
-
157
-
158
-
159
-
160
-
161
-
162
-
163
-
164
-
165
-
166
-
167
-
168
-
169
-
170
-
171
-
172
-
173
-
174
-
175
-
176
-
177
-
178
-
179
-
180
-
181
-
182
-
183
-
184
 |
 |

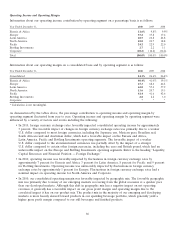
Net Operating Revenues
Year Ended December 31, 2010, versus Year Ended December 31, 2009
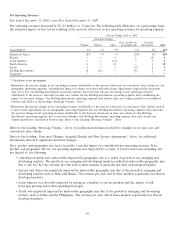
Net operating revenues increased by $4,129 million, or 13 percent. The following table illustrates, on a percentage basis,
the estimated impact of key factors resulting in the increase (decrease) in net operating revenues by operating segment:
Percent Change 2010 vs. 2009
Structural changes
Price, product & Currency
Volume1Volume2Other geographic mix fluctuations Total
Consolidated 5% —% 5% 1% 2% 13%
Eurasia & Africa 12% —% —% (2)% 6% 16%
Europe — — 2 1 (2) 1
Latin America 7 — (13) 9 3 6
North America 1 1 32 — 1 35
Pacific 6 — 1 (5) 6 8
Bottling Investments 10 (11) — (1) 2 —
Corporate * * * * * *
* Calculation is not meaningful.
1Represents the percent change in net operating revenues attributable to the increase (decrease) in concentrate sales volume for our
geographic operating segments, excluding the impact of volume associated with new license agreements (expressed in equivalent
unit cases). For our Bottling Investments operating segment, this represents the percent change in net operating revenues
attributable to the increase (decrease) in unit case volume for the Bottling Investments operating segment after considering the
impact of structural changes. Our Bottling Investments operating segment data reflects unit case volume growth for consolidated
bottlers only. Refer to the heading ‘‘Beverage Volume,’’ above.
2Represents the percent change in net operating revenues attributable to the increase (decrease) in concentrate sales volume related
to new license agreements for our geographic operating segments. For our Bottling Investments operating segment, this represents
the percent change in net operating revenues attributable to the increase (decrease) in unit case volume for the Bottling
Investments operating segment due to structural changes. Our Bottling Investments operating segment data reflects unit case
volume growth for consolidated bottlers only. Refer to the heading ‘‘Beverage Volume,’’ above.
Refer to the heading ‘‘Beverage Volume,’’ above, for additional information related to changes in our unit case and
concentrate sales volume.
Refer to the heading ‘‘Structural Changes, Acquired Brands and New License Agreements,’’ above, for additional
information related to significant structural changes.
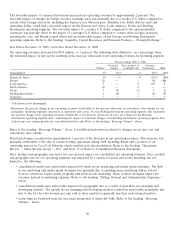
Price, product and geographic mix had a favorable 1 percent impact on consolidated net operating revenues. Price,
product and geographic mix for our operating segments was impacted by a variety of factors and events including, but
not limited to, the following:
• consolidated results were unfavorably impacted by geographic mix as a result of growth in our emerging and
developing markets. The growth in our emerging and developing markets resulted in unfavorable geographic mix
due to the fact that the revenue per unit sold in these markets is generally less than in developed markets;
• Eurasia and Africa was negatively impacted by unfavorable geographic mix due to the growth in emerging and
developing markets such as India and Russia. The revenue per unit sold in these markets is generally less than in
developed markets;
• Latin America was favorably impacted by pricing in a number of our key markets and the impact of still
beverages growing faster than sparkling beverages;
• Pacific was negatively impacted by unfavorable geographic mix due to the growth in emerging and developing
markets such as China and the Philippines. The revenue per unit sold in these markets is generally less than in
developed markets.
59