Coca Cola 2010 Annual Report Download - page 154
Download and view the complete annual report
Please find page 154 of the 2010 Coca Cola annual report below. You can navigate through the pages in the report by either clicking on the pages listed below, or by using the keyword search tool below to find specific information within the annual report.-
 1
1 -
2
-
3
-
4
-
5
-
6
-
7
-
8
-
9
-
10
-
11
-
12
-
13
-
14
-
15
-
16
-
17
-
18
-
19
-
20
-
21
-
22
-
23
-
24
-
25
-
26
-
27
-
28
-
29
-
30
-
31
-
32
-
33
-
34
-
35
-
36
-
37
-
38
-
39
-
40
-
41
-
42
-
43
-
44
-
45
-
46
-
47
-
48
-
49
-
50
-
51
-
52
-
53
-
54
-
55
-
56
-
57
-
58
-
59
-
60
-
61
-
62
-
63
-
64
-
65
-
66
-
67
-
68
-
69
-
70
-
71
-
72
-
73
-
74
-
75
-
76
-
77
-
78
-
79
-
80
-
81
-
82
-
83
-
84
-
85
-
86
-
87
-
88
-
89
-
90
-
91
-
92
-
93
-
94
-
95
-
96
-
97
-
98
-
99
-
100
-
101
-
102
-
103
-
104
-
105
-
106
-
107
-
108
-
109
-
110
-
111
-
112
-
113
-
114
-
115
-
116
-
117
-
118
-
119
-
120
-
121
-
122
-
123
-
124
-
125
-
126
-
127
-
128
-
129
-
130
-
131
-
132
-
133
-
134
-
135
-
136
-
137
-
138
-
139
-
140
-
141
-
142
-
143
-
 144
144 -
 145
145 -
 146
146 -
 147
147 -
 148
148 -
 149
149 -
 150
150 -
 151
151 -
 152
152 -
 153
153 -
 154
154 -
 155
155 -
 156
156 -
 157
157 -
 158
158 -
 159
159 -
 160
160 -
 161
161 -
 162
162 -
 163
163 -
 164
164 -
165
-
166
-
167
-
168
-
169
-
170
-
171
-
172
-
173
-
174
-
175
-
176
-
177
-
178
-
179
-
180
-
181
-
182
-
183
-
184
 |
 |
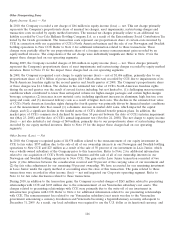
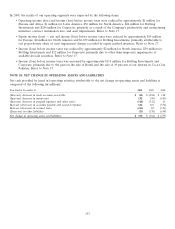
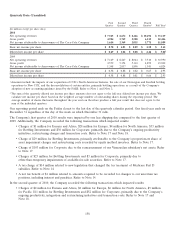
In 2010, the results of our operating segments were impacted by the following items:
• Operating income (loss) and income (loss) before income taxes were reduced by $7 million for Eurasia and
Africa, $50 million for Europe, $133 million for North America, $22 million for Pacific, $122 million for Bottling
Investments and $485 million for Corporate, primarily due to the Company’s productivity, integration and
restructuring initiatives, charitable donations, transaction costs incurred in connection with our acquisition of
CCE’s North American business and the sale of our Norwegian and Swedish bottling operations to New CCE
and other charges related to bottling activities in Eurasia. Refer to Note 17.
• Operating income (loss) and income (loss) before income taxes were reduced by $74 million for North America
due to the acceleration of expense associated with certain share-based replacement awards issued in connection
with our acquisition of CCE’s North American business. Refer to Note 12.
• Equity income (loss) — net and income (loss) before income taxes were reduced by $66 million for Bottling
Investments. This net charge was primarily attributable to the Company’s proportionate share of unusual tax
charges, asset impairments, restructuring charges and transaction costs recorded by equity method investees,
which were partially offset by our proportionate share of a foreign currency remeasurement gain recorded by an
equity method investee. The components of the net charge were individually insignificant. Refer to Note 17.
• Income (loss) before income taxes was increased by $4,978 million for Corporate due to the remeasurement of
our equity investment in CCE to fair value upon the close of the transaction. Refer to Note 2.
• Income (loss) before income taxes was reduced by $265 million for Corporate due to charges related to
preexisting relationships with CCE. These charges primarily related to the write-off of our investment in
infrastructure programs with CCE. Refer to Note 2.
• Income (loss) before income taxes was increased by $597 million for Corporate due to the gain on the sale of
our Norwegian and Swedish bottling operations to New CCE. Refer to Note 2.
• Income (loss) before income taxes was reduced by $342 million for Corporate related to the premiums paid to
repurchase the long-term debt and the costs associated with the settlement of treasury rate locks issued in
connection with the debt tender offer. Refer to Note 10.
• Income (loss) before income taxes was reduced by $103 million for Corporate due to the remeasurement of our
Venezuelan subsidiary’s net assets. Refer to Note 1.
• Income (loss) before income taxes was increased by $23 million for Corporate due to the gain on the sale of
50 percent of our investment in Le˜
ao Junior. Refer to Note 17.
• Income (loss) before income taxes was reduced by $23 million for Bottling Investments and $25 million for
Corporate due to other-than-temporary impairments and a donation of preferred shares in one of our equity
method investees. Refer to Note 17.
In 2009, the results of our operating segments were impacted by the following items:
• Operating income (loss) and income (loss) before income taxes were reduced by approximately $4 million for
Eurasia and Africa, $7 million for Europe, $31 million for North America, $1 million for Pacific, $141 million for
Bottling Investments and $129 million for Corporate, primarily as a result of the Company’s productivity,
integration and restructuring initiatives and asset impairments. Refer to Note 17.
• Equity income (loss) — net and income (loss) before income taxes were reduced by approximately $84 million
for Bottling Investments and $2 million for Corporate, primarily attributable to the Company’s proportionate
share of asset impairment and restructuring charges recorded by certain of our equity method investees. Refer to
Note 17.
• Income (loss) before income taxes was reduced by approximately $27 million for Corporate due to an
other-than-temporary impairment of a cost method investment. Refer to Note 17.
• Income (loss) before income taxes was increased by approximately $44 million for Corporate due to realized
gains on the sale of equity securities that were classified as available-for-sale. In 2008, the Company recognized
an other-than-temporary impairment related to these securities. Refer to Note 17.
152