Coca Cola 2010 Annual Report Download - page 135
Download and view the complete annual report
Please find page 135 of the 2010 Coca Cola annual report below. You can navigate through the pages in the report by either clicking on the pages listed below, or by using the keyword search tool below to find specific information within the annual report.-
 1
1 -
2
-
3
-
4
-
5
-
6
-
7
-
8
-
9
-
10
-
11
-
12
-
13
-
14
-
15
-
16
-
17
-
18
-
19
-
20
-
21
-
22
-
23
-
24
-
25
-
26
-
27
-
28
-
29
-
30
-
31
-
32
-
33
-
34
-
35
-
36
-
37
-
38
-
39
-
40
-
41
-
42
-
43
-
44
-
45
-
46
-
47
-
48
-
49
-
50
-
51
-
52
-
53
-
54
-
55
-
56
-
57
-
58
-
59
-
60
-
61
-
62
-
63
-
64
-
65
-
66
-
67
-
68
-
69
-
70
-
71
-
72
-
73
-
74
-
75
-
76
-
77
-
78
-
79
-
80
-
81
-
82
-
83
-
84
-
85
-
86
-
87
-
88
-
89
-
90
-
91
-
92
-
93
-
94
-
95
-
96
-
97
-
98
-
99
-
100
-
101
-
102
-
103
-
104
-
105
-
106
-
107
-
108
-
109
-
110
-
111
-
112
-
113
-
114
-
115
-
116
-
117
-
118
-
119
-
120
-
121
-
122
-
123
-
124
-
 125
125 -
 126
126 -
 127
127 -
 128
128 -
 129
129 -
 130
130 -
 131
131 -
 132
132 -
 133
133 -
 134
134 -
 135
135 -
 136
136 -
 137
137 -
 138
138 -
 139
139 -
 140
140 -
 141
141 -
 142
142 -
 143
143 -
 144
144 -
 145
145 -
146
-
147
-
148
-
149
-
150
-
151
-
152
-
153
-
154
-
155
-
156
-
157
-
158
-
159
-
160
-
161
-
162
-
163
-
164
-
165
-
166
-
167
-
168
-
169
-
170
-
171
-
172
-
173
-
174
-
175
-
176
-
177
-
178
-
179
-
180
-
181
-
182
-
183
-
184
 |
 |

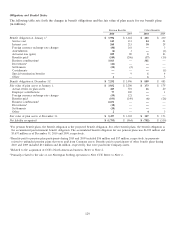
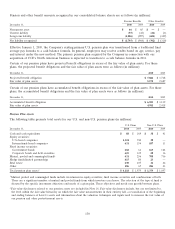
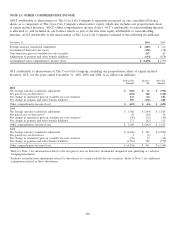
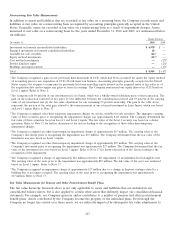
The following table sets forth the changes in AOCI for our benefit plans (in millions, pretax):
Pension Benefits Other Benefits
December 31, 2010 2009 2010 2009
Beginning balance in AOCI $ (1,119) $ (1,389) $ 118 $ 189
Recognized prior service cost (credit) 56(61) (61)
Recognized net actuarial loss (gain) 63 91 3—
Prior service credit (cost) arising in current year 6(1) —1
Net actuarial (loss) gain arising in current year 41 198 8(11)
Impact of divestitures1(8) ———
Translation gain (loss) 6(24) 4—
Ending balance in AOCI $ (1,006) $ (1,119) $72 $ 118
1Primarily related to the sale of our Norwegian bottling operation to New CCE. Refer to Note 2.
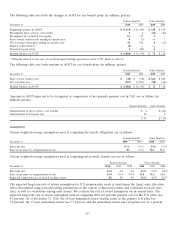
The following table sets forth amounts in AOCI for our benefit plans (in millions, pretax):
Pension Benefits Other Benefits
December 31, 2010 2009 2010 2009
Prior service credit (cost) $ (49) $ (58) $ 122 $ 184
Net actuarial loss (957) (1,061) (50) (66)
Ending balance in AOCI $ (1,006) $ (1,119) $72 $ 118
Amounts in AOCI expected to be recognized as components of net periodic pension cost in 2011 are as follows (in
millions, pretax):
Pension Benefits Other Benefits
Amortization of prior service cost (credit) $ 6 $ (61)
Amortization of actuarial loss 85 2
$ 91 $ (59)
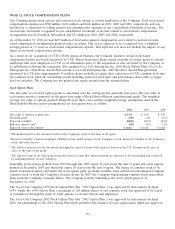
Assumptions
Certain weighted-average assumptions used in computing the benefit obligations are as follows:
Pension Benefits Other Benefits
December 31, 2010 2009 2010 2009
Discount rate 51⁄2%53⁄4%51⁄4%53⁄4%
Rate of increase in compensation levels 4% 33⁄4%N/A N/A
Certain weighted-average assumptions used in computing net periodic benefit cost are as follows:
Pension Benefits Other Benefits
December 31, 2010 2009 2008 2010 2009 2008
Discount rate 53⁄4%6% 6% 51⁄2%61⁄4%6
1⁄4%
Rate of increase in compensation levels 33⁄4%33⁄4%4
1⁄4%N/A N/A N/A
Expected long-term rate of return on plan assets 8% 8% 8% 43⁄4%43⁄4%8
1⁄2%
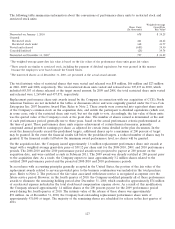
The expected long-term rate of return assumption for U.S. pension plan assets is based upon the target asset allocation
and is determined using forward-looking assumptions in the context of historical returns and volatilities for each asset
class, as well as correlations among asset classes. We evaluate the rate of return assumption on an annual basis. The
expected long-term rate of return assumption used in computing 2010 net periodic pension cost for the U.S. plans was
8.5 percent. As of December 31, 2010, the 10-year annualized return on plan assets in the primary U.S. plan was
5.2 percent, the 15-year annualized return was 7.7 percent, and the annualized return since inception was 11.2 percent.
133