Coca Cola 2010 Annual Report Download - page 37
Download and view the complete annual report
Please find page 37 of the 2010 Coca Cola annual report below. You can navigate through the pages in the report by either clicking on the pages listed below, or by using the keyword search tool below to find specific information within the annual report.-
 1
1 -
2
-
3
-
4
-
5
-
6
-
7
-
8
-
9
-
10
-
11
-
12
-
13
-
14
-
15
-
16
-
17
-
18
-
19
-
20
-
21
-
22
-
23
-
24
-
25
-
26
-
 27
27 -
 28
28 -
 29
29 -
 30
30 -
 31
31 -
 32
32 -
 33
33 -
 34
34 -
 35
35 -
 36
36 -
 37
37 -
 38
38 -
 39
39 -
 40
40 -
 41
41 -
 42
42 -
 43
43 -
 44
44 -
 45
45 -
 46
46 -
 47
47 -
48
-
49
-
50
-
51
-
52
-
53
-
54
-
55
-
56
-
57
-
58
-
59
-
60
-
61
-
62
-
63
-
64
-
65
-
66
-
67
-
68
-
69
-
70
-
71
-
72
-
73
-
74
-
75
-
76
-
77
-
78
-
79
-
80
-
81
-
82
-
83
-
84
-
85
-
86
-
87
-
88
-
89
-
90
-
91
-
92
-
93
-
94
-
95
-
96
-
97
-
98
-
99
-
100
-
101
-
102
-
103
-
104
-
105
-
106
-
107
-
108
-
109
-
110
-
111
-
112
-
113
-
114
-
115
-
116
-
117
-
118
-
119
-
120
-
121
-
122
-
123
-
124
-
125
-
126
-
127
-
128
-
129
-
130
-
131
-
132
-
133
-
134
-
135
-
136
-
137
-
138
-
139
-
140
-
141
-
142
-
143
-
144
-
145
-
146
-
147
-
148
-
149
-
150
-
151
-
152
-
153
-
154
-
155
-
156
-
157
-
158
-
159
-
160
-
161
-
162
-
163
-
164
-
165
-
166
-
167
-
168
-
169
-
170
-
171
-
172
-
173
-
174
-
175
-
176
-
177
-
178
-
179
-
180
-
181
-
182
-
183
-
184
 |
 |

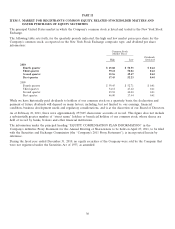
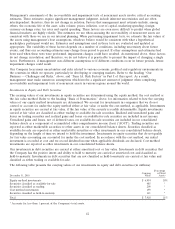
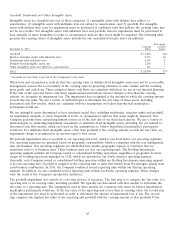
The following table sets forth the percentage of total net operating revenues related to concentrate operations and
finished products operations, respectively:
Year Ended December 31, 2010 2009 2008
Concentrate operations151% 54% 54%
Finished products operations249346 46
Net operating revenues 100% 100% 100%
1Includes concentrates sold by the Company to authorized bottling partners for the manufacture of fountain syrups. The bottlers
then typically sell the fountain syrups to wholesalers or directly to fountain retailers.
2Includes fountain syrups manufactured by the Company, including consolidated bottling operations, and sold to fountain retailers or
to authorized fountain wholesalers or bottling partners who resell the fountain syrups to fountain retailers.
3Includes net operating revenues related to the acquired CCE North American business from October 2, 2010.
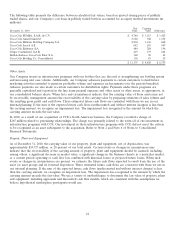
The following table sets forth the percentage of total worldwide unit case volume related to concentrate operations and
finished products operations, respectively:
Year Ended December 31, 2010 2009 2008
Concentrate operations176% 78% 77%
Finished products operations224322 23
Total worldwide unit case volume 100% 100% 100%
1Includes unit case volume related to concentrates sold by the Company to authorized bottling partners for the manufacture of
fountain syrups. The bottlers then typically sell the fountain syrups to wholesalers or directly to fountain retailers.
2Includes unit case volume related to fountain syrups manufactured by the Company, including consolidated bottling operations, and
sold to fountain retailers or to authorized fountain wholesalers or bottling partners who resell the fountain syrups to fountain
retailers.
3Includes unit case volume related to the acquired CCE North American business from October 2, 2010.
Acquisition of CCE’s North American Business and Related Transactions
Pursuant to the terms of the business separation and merger agreement entered into on February 25, 2010, as amended
(the ‘‘merger agreement’’), on October 2, 2010 (the ‘‘acquisition date’’), we acquired CCE’s North American business,
consisting of CCE’s production, sales and distribution operations in the United States, Canada, the British Virgin
Islands, the United States Virgin Islands and the Cayman Islands, and a substantial majority of CCE’s corporate
segment. We believe this acquisition will result in an evolved franchise system that will enable us to better serve the
unique needs of the North American market. The creation of a unified operating system will strategically position us to
better market and distribute our nonalcoholic beverage brands in North America.
Under the terms of the merger agreement, the Company acquired the 67 percent of CCE’s North American business
that was not already owned by the Company for consideration that included: (1) the Company’s 33 percent indirect
ownership interest in CCE’s European operations; (2) cash consideration; and (3) replacement awards issued to certain
current and former employees of CCE’s North American and corporate operations. At closing, CCE shareowners other
than the Company exchanged their CCE common stock for common stock in a new entity, which was renamed
Coca-Cola Enterprises, Inc. (which is referred to herein as ‘‘New CCE’’) and which continues to hold the European
operations held by CCE prior to the acquisition. At closing, New CCE became 100 percent owned by shareowners that
held shares of common stock of CCE immediately prior to the closing, other than the Company. As a result of this
transaction, the Company does not own any interest in New CCE.
As of October 1, 2010, our Company owned approximately 33 percent of the outstanding common stock of CCE. Based
on the closing price of CCE’s common stock on the last day of trading prior to the acquisition date, the fair value of
our investment in CCE was approximately $5,373 million, which reflected the fair value of our ownership in both CCE’s
North American business and its European operations. We remeasured our equity interest in CCE to fair value upon
35