Coca Cola 2010 Annual Report Download - page 63
Download and view the complete annual report
Please find page 63 of the 2010 Coca Cola annual report below. You can navigate through the pages in the report by either clicking on the pages listed below, or by using the keyword search tool below to find specific information within the annual report.-
 1
1 -
2
-
3
-
4
-
5
-
6
-
7
-
8
-
9
-
10
-
11
-
12
-
13
-
14
-
15
-
16
-
17
-
18
-
19
-
20
-
21
-
22
-
23
-
24
-
25
-
26
-
27
-
28
-
29
-
30
-
31
-
32
-
33
-
34
-
35
-
36
-
37
-
38
-
39
-
40
-
41
-
42
-
43
-
44
-
45
-
46
-
47
-
48
-
49
-
50
-
51
-
52
-
 53
53 -
 54
54 -
 55
55 -
 56
56 -
 57
57 -
 58
58 -
 59
59 -
 60
60 -
 61
61 -
 62
62 -
 63
63 -
 64
64 -
 65
65 -
 66
66 -
 67
67 -
 68
68 -
 69
69 -
 70
70 -
 71
71 -
 72
72 -
 73
73 -
74
-
75
-
76
-
77
-
78
-
79
-
80
-
81
-
82
-
83
-
84
-
85
-
86
-
87
-
88
-
89
-
90
-
91
-
92
-
93
-
94
-
95
-
96
-
97
-
98
-
99
-
100
-
101
-
102
-
103
-
104
-
105
-
106
-
107
-
108
-
109
-
110
-
111
-
112
-
113
-
114
-
115
-
116
-
117
-
118
-
119
-
120
-
121
-
122
-
123
-
124
-
125
-
126
-
127
-
128
-
129
-
130
-
131
-
132
-
133
-
134
-
135
-
136
-
137
-
138
-
139
-
140
-
141
-
142
-
143
-
144
-
145
-
146
-
147
-
148
-
149
-
150
-
151
-
152
-
153
-
154
-
155
-
156
-
157
-
158
-
159
-
160
-
161
-
162
-
163
-
164
-
165
-
166
-
167
-
168
-
169
-
170
-
171
-
172
-
173
-
174
-
175
-
176
-
177
-
178
-
179
-
180
-
181
-
182
-
183
-
184
 |
 |

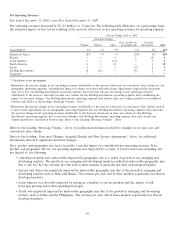
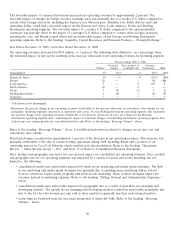
• North America was favorably impacted by the growth of our still beverage volume, primarily due to the strong
performance of Fuze, Trademark Simply and tea. Refer to the heading ‘‘Beverage Volume,’’ above;
• Pacific was negatively impacted by unfavorable geographic mix due to the growth in emerging and developing
markets such as China and a decline in Japan, a developed market. Refer to the heading ‘‘Beverage Volume,’’
above. The revenue per unit sold in emerging and developing markets is generally less than in developed
markets. The Pacific operating segment was also unfavorably impacted by shifts away from the at-work vending
channel in our Japanese business.
The unfavorable impact of currency fluctuations decreased net operating revenues by approximately 5 percent. The
unfavorable impact of changes in foreign currency exchange rates was primarily due to a stronger U.S. dollar compared
to most foreign currencies, including the euro, South African rand, British pound, Brazilian real, Mexican peso and
Australian dollar, which had an unfavorable impact on the Eurasia and Africa, Europe, Latin America, Pacific and
Bottling Investments operating segments. The unfavorable impact of a stronger U.S. dollar compared to the
aforementioned currencies was partially offset by the impact of a weaker U.S. dollar compared to certain other foreign
currencies, including the Japanese yen, which had a favorable impact on the Pacific operating segment. Refer to the
heading ‘‘Liquidity, Capital Resources and Financial Position — Foreign Exchange.’’
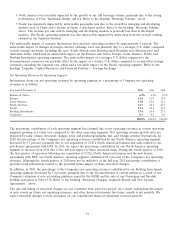
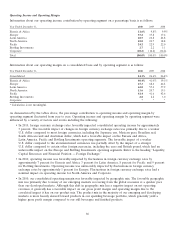
Net Operating Revenues by Operating Segment
Information about our net operating revenues by operating segment as a percentage of Company net operating
revenues is as follows:
Year Ended December 31, 2010 2009 2008
Eurasia & Africa 6.9% 6.4% 6.7%
Europe 12.6 13.9 15.0
Latin America 11.0 12.0 11.3
North America 31.7 26.4 25.7
Pacific 14.1 14.6 13.7
Bottling Investments 23.4 26.4 27.3
Corporate 0.3 0.3 0.3
100.0% 100.0% 100.0%
The percentage contribution of each operating segment has changed due to net operating revenues in certain operating
segments growing at a faster rate compared to the other operating segments. Net operating revenue growth rates are
impacted by sales volume, structural changes, price and product/geographic mix, and foreign currency fluctuations. In
2010, the percentage of the Company’s net operating revenues contributed by our North America operating segment
increased by 5.3 percent, primarily due to our acquisition of CCE’s North American business and sales related to our
new license agreements with DPS. In 2011, we expect the percentage contribution by our North America operating
segment to increase from 2010 due to the full year impact of these structural items. During the fourth quarter of 2010,
the first quarter of operation following our acquisition of CCE’s North American business and the new license
agreements with DPS, our North America operating segment contributed 45.8 percent of the Company’s net operating
revenues. Although the fourth quarter of 2010 may not be indicative of the full year 2011 percentage contribution, it
provides trend information related to the potential future impact of these structural changes.
In addition, in 2010, the percentage of the Company’s net operating revenues contributed by our Bottling Investments
operating segment decreased by 3.0 percent, primarily due to the deconsolidation of certain entities as a result of the
Company’s adoption of new accounting guidance issued by the FASB and the sale of our Norwegian and Swedish
bottling operations to New CCE. Refer to the heading ‘‘Structural Changes, Acquired Brands and New License
Agreements,’’ above.
The size and timing of structural changes are not consistent from period to period. As a result, anticipating the impact
of such events on future net operating revenues, and other financial statement line items, usually is not possible. We
expect structural changes to have an impact on our consolidated financial statements in future periods.
61