Coca Cola 2010 Annual Report Download - page 121
Download and view the complete annual report
Please find page 121 of the 2010 Coca Cola annual report below. You can navigate through the pages in the report by either clicking on the pages listed below, or by using the keyword search tool below to find specific information within the annual report.-
 1
1 -
2
-
3
-
4
-
5
-
6
-
7
-
8
-
9
-
10
-
11
-
12
-
13
-
14
-
15
-
16
-
17
-
18
-
19
-
20
-
21
-
22
-
23
-
24
-
25
-
26
-
27
-
28
-
29
-
30
-
31
-
32
-
33
-
34
-
35
-
36
-
37
-
38
-
39
-
40
-
41
-
42
-
43
-
44
-
45
-
46
-
47
-
48
-
49
-
50
-
51
-
52
-
53
-
54
-
55
-
56
-
57
-
58
-
59
-
60
-
61
-
62
-
63
-
64
-
65
-
66
-
67
-
68
-
69
-
70
-
71
-
72
-
73
-
74
-
75
-
76
-
77
-
78
-
79
-
80
-
81
-
82
-
83
-
84
-
85
-
86
-
87
-
88
-
89
-
90
-
91
-
92
-
93
-
94
-
95
-
96
-
97
-
98
-
99
-
100
-
101
-
102
-
103
-
104
-
105
-
106
-
107
-
108
-
109
-
110
-
 111
111 -
 112
112 -
 113
113 -
 114
114 -
 115
115 -
 116
116 -
 117
117 -
 118
118 -
 119
119 -
 120
120 -
 121
121 -
 122
122 -
 123
123 -
 124
124 -
 125
125 -
 126
126 -
 127
127 -
 128
128 -
 129
129 -
 130
130 -
 131
131 -
132
-
133
-
134
-
135
-
136
-
137
-
138
-
139
-
140
-
141
-
142
-
143
-
144
-
145
-
146
-
147
-
148
-
149
-
150
-
151
-
152
-
153
-
154
-
155
-
156
-
157
-
158
-
159
-
160
-
161
-
162
-
163
-
164
-
165
-
166
-
167
-
168
-
169
-
170
-
171
-
172
-
173
-
174
-
175
-
176
-
177
-
178
-
179
-
180
-
181
-
182
-
183
-
184
 |
 |

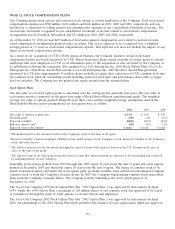
The following table provides information related to the carrying value of our goodwill by operating segment (in
millions):
Eurasia & Latin North Bottling
Africa Europe America America Pacific Investments Total
2009
Balance as of January 1 $ 36 $ 739 $ 229 $ 2,156 $ 106 $ 763 $ 4,029
Effect of foreign currency translation 5 52 59 — 4 55 175
Acquisitions 2 6 36 — — — 44
Adjustments related to the finalization of
purchase accounting — — (4) (2) — (14) (20)
Divestitures and deconsolidations — — — — — (4) (4)
Balance as of December 31 $ 43 $ 797 $ 320 $ 2,154 $ 110 $ 800 $ 4,224
2010
Balance as of January 1 $ 43 $ 797 $ 320 $ 2,154 $ 110 $ 800 $ 4,224
Effect of foreign currency translation 1 (102) 4 — 2 (39) (134)
Acquisitions1— — 54 7,746 — 83 7,883
Adjustments related to the finalization of
purchase accounting —— — —— — —
Divestitures and deconsolidations1,2 — — (212) (39) — (57) (308)
Balance as of December 31 $ 44 $ 695 $ 166 $ 9,861 $ 112 $ 787 $ 11,665
1Refer to Note 2 for information related to significant acquisitions and divestitures.
2Refer to Note 1 for information related to the deconsolidation of certain entities as a result of the Company’s adoption of new
accounting guidance issued by the FASB.
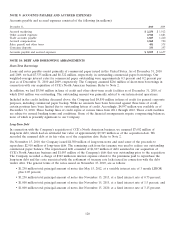
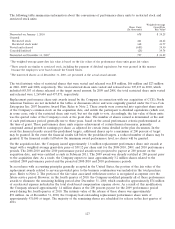
Definite-lived Intangible Assets
The following table summarizes information related to definite-lived intangible assets (in millions):
December 31, 2010 2009
Customer relationships1$ 606 $ 231
Bottlers’ franchise rights2605 —
Trademarks 111 106
Other 258 240
Gross carrying amount 1,580 577
Less accumulated amortization (316) (233)
Definite-lived intangible assets — net $ 1,264 $ 344
1The increase in 2010 was primarily related to the acquisition of customer relationships from CCE. Refer to Note 2.
2The increase in 2010 was primarily related to the reacquisition of CCE’s rights to distribute the Company’s beverages in Canada
and certain of the Company’s beverages, other than Trademark Coca-Cola Beverages, in the United States. Refer to Note 2.
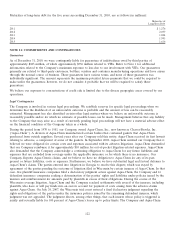
Total amortization expense for intangible assets subject to amortization was $102 million, $63 million and $54 million in
2010, 2009 and 2008, respectively. Based on the carrying value of definite-lived intangible assets as of December 31,
2010, we estimate our amortization expense for the next five years will be as follows (in millions):
Amortization
Expense
2011 $ 176
2012 152
2013 139
2014 136
2015 129
119