Coca Cola 2010 Annual Report Download - page 136
Download and view the complete annual report
Please find page 136 of the 2010 Coca Cola annual report below. You can navigate through the pages in the report by either clicking on the pages listed below, or by using the keyword search tool below to find specific information within the annual report.-
 1
1 -
2
-
3
-
4
-
5
-
6
-
7
-
8
-
9
-
10
-
11
-
12
-
13
-
14
-
15
-
16
-
17
-
18
-
19
-
20
-
21
-
22
-
23
-
24
-
25
-
26
-
27
-
28
-
29
-
30
-
31
-
32
-
33
-
34
-
35
-
36
-
37
-
38
-
39
-
40
-
41
-
42
-
43
-
44
-
45
-
46
-
47
-
48
-
49
-
50
-
51
-
52
-
53
-
54
-
55
-
56
-
57
-
58
-
59
-
60
-
61
-
62
-
63
-
64
-
65
-
66
-
67
-
68
-
69
-
70
-
71
-
72
-
73
-
74
-
75
-
76
-
77
-
78
-
79
-
80
-
81
-
82
-
83
-
84
-
85
-
86
-
87
-
88
-
89
-
90
-
91
-
92
-
93
-
94
-
95
-
96
-
97
-
98
-
99
-
100
-
101
-
102
-
103
-
104
-
105
-
106
-
107
-
108
-
109
-
110
-
111
-
112
-
113
-
114
-
115
-
116
-
117
-
118
-
119
-
120
-
121
-
122
-
123
-
124
-
125
-
 126
126 -
 127
127 -
 128
128 -
 129
129 -
 130
130 -
 131
131 -
 132
132 -
 133
133 -
 134
134 -
 135
135 -
 136
136 -
 137
137 -
 138
138 -
 139
139 -
 140
140 -
 141
141 -
 142
142 -
 143
143 -
 144
144 -
 145
145 -
 146
146 -
147
-
148
-
149
-
150
-
151
-
152
-
153
-
154
-
155
-
156
-
157
-
158
-
159
-
160
-
161
-
162
-
163
-
164
-
165
-
166
-
167
-
168
-
169
-
170
-
171
-
172
-
173
-
174
-
175
-
176
-
177
-
178
-
179
-
180
-
181
-
182
-
183
-
184
 |
 |

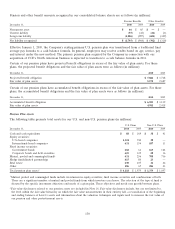
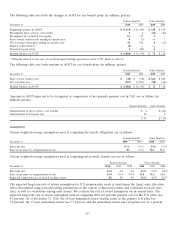
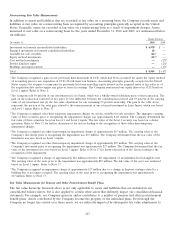
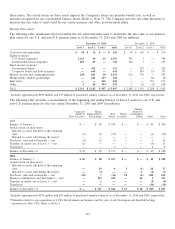
The assumed health care cost trend rates are as follows:
December 31, 2010 2009
Health care cost trend rate assumed for next year 81⁄2%71⁄2%
Rate to which the cost trend rate is assumed to decline (the ultimate trend rate) 5% 51⁄4%
Year that the rate reaches the ultimate trend rate 2018 2012
The Company’s U.S. postretirement benefit plans are primarily defined dollar benefit plans that limit the effects of
medical inflation because the plans have established dollar limits for determining our contributions. As a result, the
effect of a 1 percentage point change in the assumed health care cost trend rate would not be significant to the
Company.
The discount rate assumptions used to account for pension and other postretirement benefit plans reflect the rates at
which the benefit obligations could be effectively settled. Rates for each of our U.S. plans at December 31, 2010, were
determined using a cash flow matching technique whereby the rates of a yield curve, developed from high-quality debt
securities, were applied to the benefit obligations to determine the appropriate discount rate. For our non-U.S. plans,
we base the discount rate on comparable indices within each of the countries. The rate of compensation increase
assumption is determined by the Company based upon annual reviews. We review external data and our own historical
trends for health care costs to determine the health care cost trend rate assumptions.
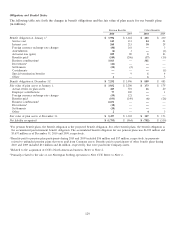
Cash Flows
Our estimated future benefit payments for funded and unfunded plans are as follows (in millions):
Year Ended December 31, 2011 2012 2013 2014 2015 2016–2020
Pension benefit payments $ 465 $ 442 $ 461 $ 486 $ 510 $ 2,800
Other benefit payments155 59 62 63 65 339
Total estimated benefit payments $ 520 $ 501 $ 523 $ 549 $ 575 $ 3,139
1The expected benefit payments for our other postretirement benefit plans are net of estimated federal subsidies expected to be
received under the Medicare Prescription Drug, Improvement and Modernization Act of 2003. Federal subsidies are estimated to
be approximately $19 million for the period 2011–2015, and $24 million for the period 2016–2020.
On March 23, 2010, the Patient Protection and Affordable Care Act (HR 3590) (the ‘‘Act’’) was signed into law. As a
result of this legislation, entities are no longer eligible to receive a tax deduction for the portion of prescription drug
expenses reimbursed under the Medicare Part D subsidy. This change resulted in a reduction of our deferred tax assets
and a corresponding charge to income tax expense of $14 million during the first quarter of 2010.
We anticipate making contributions in 2011 of approximately $800 million of which approximately half will be allocated
to our primary U.S. pension plans. The majority of these contributions are discretionary.
Defined Contribution Plans
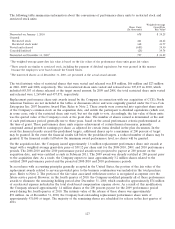
Our Company sponsors qualified defined contribution plans covering substantially all U.S. employees. Under the
primary U.S. defined contribution plans, we match participants’ contributions up to a maximum of 3.0 percent to 3.5
percent of compensation, subject to certain limitations. Company costs related to the U.S. plans were $44 million,
$27 million and $22 million in 2010, 2009 and 2008, respectively. We also sponsor defined contribution plans in certain
locations outside the United States. Company costs associated with those plans were $35 million, $36 million and
$20 million in 2010, 2009 and 2008, respectively.
Multi-Employer Plans
As a result of our acquisition of CCE’s North American business, the Company now participates in various multi-
employer pension plans in the United States. Our pension expense for U.S. multi-employer plans totaled $9 million in
2010. The plans we participate in have contractual arrangements that extend into 2015. If, in the future, we choose to
withdraw from these plans, we will likely need to record withdrawal liabilities, some of which may be material.
134