Coca Cola 2010 Annual Report Download - page 118
Download and view the complete annual report
Please find page 118 of the 2010 Coca Cola annual report below. You can navigate through the pages in the report by either clicking on the pages listed below, or by using the keyword search tool below to find specific information within the annual report.-
 1
1 -
2
-
3
-
4
-
5
-
6
-
7
-
8
-
9
-
10
-
11
-
12
-
13
-
14
-
15
-
16
-
17
-
18
-
19
-
20
-
21
-
22
-
23
-
24
-
25
-
26
-
27
-
28
-
29
-
30
-
31
-
32
-
33
-
34
-
35
-
36
-
37
-
38
-
39
-
40
-
41
-
42
-
43
-
44
-
45
-
46
-
47
-
48
-
49
-
50
-
51
-
52
-
53
-
54
-
55
-
56
-
57
-
58
-
59
-
60
-
61
-
62
-
63
-
64
-
65
-
66
-
67
-
68
-
69
-
70
-
71
-
72
-
73
-
74
-
75
-
76
-
77
-
78
-
79
-
80
-
81
-
82
-
83
-
84
-
85
-
86
-
87
-
88
-
89
-
90
-
91
-
92
-
93
-
94
-
95
-
96
-
97
-
98
-
99
-
100
-
101
-
102
-
103
-
104
-
105
-
106
-
107
-
 108
108 -
 109
109 -
 110
110 -
 111
111 -
 112
112 -
 113
113 -
 114
114 -
 115
115 -
 116
116 -
 117
117 -
 118
118 -
 119
119 -
 120
120 -
 121
121 -
 122
122 -
 123
123 -
 124
124 -
 125
125 -
 126
126 -
 127
127 -
 128
128 -
129
-
130
-
131
-
132
-
133
-
134
-
135
-
136
-
137
-
138
-
139
-
140
-
141
-
142
-
143
-
144
-
145
-
146
-
147
-
148
-
149
-
150
-
151
-
152
-
153
-
154
-
155
-
156
-
157
-
158
-
159
-
160
-
161
-
162
-
163
-
164
-
165
-
166
-
167
-
168
-
169
-
170
-
171
-
172
-
173
-
174
-
175
-
176
-
177
-
178
-
179
-
180
-
181
-
182
-
183
-
184
 |
 |

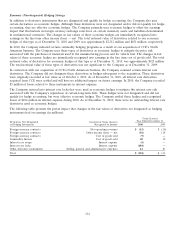
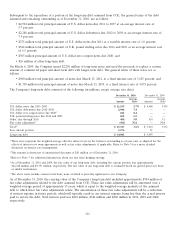
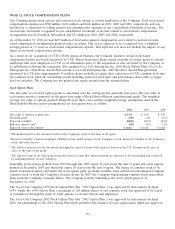
The following table provides a summary of our significant transactions with CCE for the nine months ended October 1,
2010, and for the years ended December 31, 2009 and 2008 (in millions):
Year Ended December 31,
Nine Months Ended
October 1, 2010 2009 2008
Concentrate, syrup and finished product sales to CCE $ 4,737 $ 6,032 $ 6,431
Syrup and finished product purchases from CCE 263 351 344
CCE purchases of sweeteners through our Company 251 419 357
Marketing payments made by us directly to CCE 314 415 626
Marketing payments made to third parties on behalf of CCE 106 174 131
Local media and marketing program reimbursements from CCE 268 330 316
Payments made to CCE for dispensing equipment repair services 64 87 84
Other payments — net 19 66 75
Syrup and finished product purchases from CCE represent purchases of fountain syrup in certain territories that have
been resold by our Company to major customers and purchases of bottle and can products. Marketing payments made
by us directly to CCE represent support of certain marketing activities and our participation with CCE in cooperative
advertising and other marketing activities to promote the sale of Company trademark products within CCE territories.
These programs were agreed to on an annual basis. Marketing payments made to third parties on behalf of CCE
represent support of certain marketing activities and programs to promote the sale of Company trademark products
within CCE’s territories in conjunction with certain of CCE’s customers. Pursuant to cooperative advertising and trade
agreements with CCE, we received funds from CCE for local media and marketing program reimbursements. Payments
made to CCE for dispensing equipment repair services represent reimbursement to CCE for its costs of parts and labor
for repairs on cooler, dispensing or post-mix equipment owned by us or our customers. The other payments — net line
in the table above represents payments made to and received from CCE that are individually not significant.
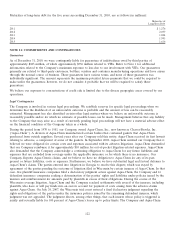
Our Company had previously entered into programs with CCE designed to help develop cold-drink infrastructure.
Under these programs, we paid CCE for a portion of the cost of developing the infrastructure necessary to support
accelerated placements of cold-drink equipment. These payments supported a common objective of increased sales of
Company Trademark Beverages from increased availability and consumption in the cold-drink channel. The amortizable
carrying value of our investment in these infrastructure programs with CCE was $307 million as of December 31, 2009.
Preexisting Relationships
The Company evaluated all of our preexisting relationships with CCE prior to the close of the transaction. Based on
these evaluations, the Company recognized a charge of $265 million related to preexisting relationships with CCE. This
charge primarily related to the write-off of our investment in cold-drink infrastructure programs with CCE. This charge
was recorded in the line item other income (loss) — net and impacted the Corporate operating segment. Refer to
Note 17.
116