Coca Cola 2010 Annual Report Download - page 152
Download and view the complete annual report
Please find page 152 of the 2010 Coca Cola annual report below. You can navigate through the pages in the report by either clicking on the pages listed below, or by using the keyword search tool below to find specific information within the annual report.-
 1
1 -
2
-
3
-
4
-
5
-
6
-
7
-
8
-
9
-
10
-
11
-
12
-
13
-
14
-
15
-
16
-
17
-
18
-
19
-
20
-
21
-
22
-
23
-
24
-
25
-
26
-
27
-
28
-
29
-
30
-
31
-
32
-
33
-
34
-
35
-
36
-
37
-
38
-
39
-
40
-
41
-
42
-
43
-
44
-
45
-
46
-
47
-
48
-
49
-
50
-
51
-
52
-
53
-
54
-
55
-
56
-
57
-
58
-
59
-
60
-
61
-
62
-
63
-
64
-
65
-
66
-
67
-
68
-
69
-
70
-
71
-
72
-
73
-
74
-
75
-
76
-
77
-
78
-
79
-
80
-
81
-
82
-
83
-
84
-
85
-
86
-
87
-
88
-
89
-
90
-
91
-
92
-
93
-
94
-
95
-
96
-
97
-
98
-
99
-
100
-
101
-
102
-
103
-
104
-
105
-
106
-
107
-
108
-
109
-
110
-
111
-
112
-
113
-
114
-
115
-
116
-
117
-
118
-
119
-
120
-
121
-
122
-
123
-
124
-
125
-
126
-
127
-
128
-
129
-
130
-
131
-
132
-
133
-
134
-
135
-
136
-
137
-
138
-
139
-
140
-
141
-
 142
142 -
 143
143 -
 144
144 -
 145
145 -
 146
146 -
 147
147 -
 148
148 -
 149
149 -
 150
150 -
 151
151 -
 152
152 -
 153
153 -
 154
154 -
 155
155 -
 156
156 -
 157
157 -
 158
158 -
 159
159 -
 160
160 -
 161
161 -
 162
162 -
163
-
164
-
165
-
166
-
167
-
168
-
169
-
170
-
171
-
172
-
173
-
174
-
175
-
176
-
177
-
178
-
179
-
180
-
181
-
182
-
183
-
184
 |
 |

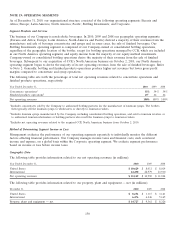
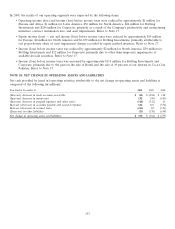
NOTE 19: OPERATING SEGMENTS
As of December 31, 2010, our organizational structure consisted of the following operating segments: Eurasia and
Africa; Europe; Latin America; North America; Pacific; Bottling Investments; and Corporate.
Segment Products and Services
The business of our Company is nonalcoholic beverages. In 2010, 2009 and 2008 our geographic operating segments
(Eurasia and Africa; Europe; Latin America; North America and Pacific) derived a majority of their revenues from the
manufacture and sale of beverage concentrates and syrups and, in some cases, the sale of finished beverages. Our
Bottling Investments operating segment is comprised of our Company-owned or consolidated bottling operations,
regardless of the geographic location of the bottler, except for bottling operations managed by CCR, which are included
in our North America operating segment, and equity income from the majority of our equity method investments.
Company-owned or consolidated bottling operations derive the majority of their revenues from the sale of finished
beverages. Subsequent to our acquisition of CCE’s North American business on October 2, 2010, our North America
operating segment began to derive the majority of its net operating revenues from the sale of finished beverages. Refer
to Note 2. Generally, bottling and finished products operations produce higher net revenues but lower gross profit
margins compared to concentrate and syrup operations.
The following table sets forth the percentage of total net operating revenues related to concentrate operations and
finished products operations, respectively:
Year Ended December 31, 2010 2009 2008
Concentrate operations151% 54% 54%
Finished products operations249346 46
Net operating revenues 100% 100% 100%
1Includes concentrates sold by the Company to authorized bottling partners for the manufacture of fountain syrups. The bottlers
then typically sell the fountain syrups to wholesalers or directly to fountain retailers.
2Includes fountain syrups manufactured by the Company, including consolidated bottling operations, and sold to fountain retailers or
to authorized fountain wholesalers or bottling partners who resell the fountain syrups to fountain retailers.
3Includes net operating revenues related to the acquired CCE North American business from October 2, 2010.
Method of Determining Segment Income or Loss
Management evaluates the performance of our operating segments separately to individually monitor the different
factors affecting financial performance. Our Company manages income taxes and financial costs, such as interest
income and expense, on a global basis within the Corporate operating segment. We evaluate segment performance
based on income or loss before income taxes.
Geographic Data
The following table provides information related to our net operating revenues (in millions):
Year Ended December 31, 2010 2009 2008
United States $ 10,629 $ 8,011 $ 8,014
International 24,490 22,979 23,930
Net operating revenues $ 35,119 $ 30,990 $ 31,944
The following table provides information related to our property, plant and equipment — net (in millions):
December 31, 2010 2009 2008
United States $ 8,251 $ 3,115 $ 3,161
International 6,476 6,446 5,165
Property, plant and equipment — net $ 14,727 $ 9,561 $ 8,326
150