Coca Cola 2010 Annual Report Download - page 147
Download and view the complete annual report
Please find page 147 of the 2010 Coca Cola annual report below. You can navigate through the pages in the report by either clicking on the pages listed below, or by using the keyword search tool below to find specific information within the annual report.-
 1
1 -
2
-
3
-
4
-
5
-
6
-
7
-
8
-
9
-
10
-
11
-
12
-
13
-
14
-
15
-
16
-
17
-
18
-
19
-
20
-
21
-
22
-
23
-
24
-
25
-
26
-
27
-
28
-
29
-
30
-
31
-
32
-
33
-
34
-
35
-
36
-
37
-
38
-
39
-
40
-
41
-
42
-
43
-
44
-
45
-
46
-
47
-
48
-
49
-
50
-
51
-
52
-
53
-
54
-
55
-
56
-
57
-
58
-
59
-
60
-
61
-
62
-
63
-
64
-
65
-
66
-
67
-
68
-
69
-
70
-
71
-
72
-
73
-
74
-
75
-
76
-
77
-
78
-
79
-
80
-
81
-
82
-
83
-
84
-
85
-
86
-
87
-
88
-
89
-
90
-
91
-
92
-
93
-
94
-
95
-
96
-
97
-
98
-
99
-
100
-
101
-
102
-
103
-
104
-
105
-
106
-
107
-
108
-
109
-
110
-
111
-
112
-
113
-
114
-
115
-
116
-
117
-
118
-
119
-
120
-
121
-
122
-
123
-
124
-
125
-
126
-
127
-
128
-
129
-
130
-
131
-
132
-
133
-
134
-
135
-
136
-
 137
137 -
 138
138 -
 139
139 -
 140
140 -
 141
141 -
 142
142 -
 143
143 -
 144
144 -
 145
145 -
 146
146 -
 147
147 -
 148
148 -
 149
149 -
 150
150 -
 151
151 -
 152
152 -
 153
153 -
 154
154 -
 155
155 -
 156
156 -
 157
157 -
158
-
159
-
160
-
161
-
162
-
163
-
164
-
165
-
166
-
167
-
168
-
169
-
170
-
171
-
172
-
173
-
174
-
175
-
176
-
177
-
178
-
179
-
180
-
181
-
182
-
183
-
184
 |
 |

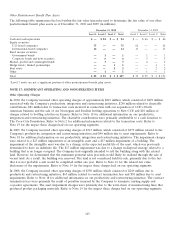
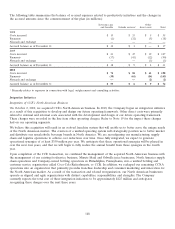
Other Postretirement Benefit Plan Assets
The following table summarizes the level within the fair value hierarchy used to determine the fair value of our other
postretirement benefit plan assets as of December 31, 2010 and 2009 (in millions):
December 31, 2010 December 31, 2009
Level 1 Level 2 Level 31Total Level 1 Level 2 Level 31Total
Cash and cash equivalents $— $84 $— $ 84 $— $86 $— $ 86
Equity securities:
U.S.-based companies 75 — — 75 62 — — 62
International-based companies 14 — — 14 13 — — 13
Fixed income securities:
Government bonds —1—1 —1—1
Corporate bonds and debt securities —6—6 —5—5
Mutual, pooled and commingled funds —3—3 —2—2
Hedge funds / limited partnerships —— 1 1 —— 1 1
Real estate —— 2 2 —— 2 2
Other —1—1 —1—1
Total $ 89 $ 95 $ 3 $ 187 $ 75 $ 95 $ 3 $ 173
1Level 3 assets are not a significant portion of other postretirement benefit plan assets.
NOTE 17: SIGNIFICANT OPERATING AND NONOPERATING ITEMS
Other Operating Charges
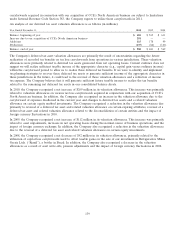
In 2010, the Company incurred other operating charges of approximately $819 million, which consisted of $478 million
associated with the Company’s productivity, integration and restructuring initiatives, $250 million related to charitable
contributions, $81 million due to transaction costs incurred in connection with our acquisition of CCE’s North
American business and the sale of our Norwegian and Swedish bottling operations to New CCE and $10 million of
charges related to bottling activities in Eurasia. Refer to Note 18 for additional information on our productivity,
integration and restructuring initiatives. The charitable contributions were primarily attributable to a cash donation to
The Coca-Cola Foundation. Refer to Note 2 for additional information related to the transaction costs. Refer to
Note 19 for the impact these charges had on our operating segments.
In 2009, the Company incurred other operating charges of $313 million, which consisted of $273 million related to the
Company’s productivity, integration and restructuring initiatives and $40 million due to asset impairments. Refer to
Note 18 for additional information on our productivity, integration and restructuring initiatives. The impairment charges
were related to a $23 million impairment of an intangible asset and a $17 million impairment of a building. The
impairment of the intangible asset was due to a change in the expected useful life of the asset, which was previously
determined to have an indefinite life. The $17 million impairment was due to a change in disposal strategy related to a
building that is no longer occupied. The Company had originally intended to sell the building along with the related
land. However, we determined that the maximum potential sales proceeds would likely be realized through the sale of
vacant land. As a result, the building was removed. The land is not considered held-for-sale, primarily due to the fact
that it is not probable a sale would be completed within one year. Refer to Note 16 for the related fair value
disclosures of the impairments. Refer to Note 19 for the impact these charges had on our operating segments.
In 2008, the Company incurred other operating charges of $350 million, which consisted of $249 million due to
productivity and restructuring initiatives, $63 million related to contract termination fees and $38 million due to asset
impairments. Refer to Note 18 for additional information on our productivity and restructuring initiatives. The contract
termination fees were primarily the result of penalties incurred by the Company to terminate existing supply and
co-packer agreements. The asset impairment charges were primarily due to the write-down of manufacturing lines that
produced product packaging materials. Refer to Note 19 for the impact these charges had on our operating segments.
145