Coca Cola 2010 Annual Report Download - page 160
Download and view the complete annual report
Please find page 160 of the 2010 Coca Cola annual report below. You can navigate through the pages in the report by either clicking on the pages listed below, or by using the keyword search tool below to find specific information within the annual report.-
 1
1 -
2
-
3
-
4
-
5
-
6
-
7
-
8
-
9
-
10
-
11
-
12
-
13
-
14
-
15
-
16
-
17
-
18
-
19
-
20
-
21
-
22
-
23
-
24
-
25
-
26
-
27
-
28
-
29
-
30
-
31
-
32
-
33
-
34
-
35
-
36
-
37
-
38
-
39
-
40
-
41
-
42
-
43
-
44
-
45
-
46
-
47
-
48
-
49
-
50
-
51
-
52
-
53
-
54
-
55
-
56
-
57
-
58
-
59
-
60
-
61
-
62
-
63
-
64
-
65
-
66
-
67
-
68
-
69
-
70
-
71
-
72
-
73
-
74
-
75
-
76
-
77
-
78
-
79
-
80
-
81
-
82
-
83
-
84
-
85
-
86
-
87
-
88
-
89
-
90
-
91
-
92
-
93
-
94
-
95
-
96
-
97
-
98
-
99
-
100
-
101
-
102
-
103
-
104
-
105
-
106
-
107
-
108
-
109
-
110
-
111
-
112
-
113
-
114
-
115
-
116
-
117
-
118
-
119
-
120
-
121
-
122
-
123
-
124
-
125
-
126
-
127
-
128
-
129
-
130
-
131
-
132
-
133
-
134
-
135
-
136
-
137
-
138
-
139
-
140
-
141
-
142
-
143
-
144
-
145
-
146
-
147
-
148
-
149
-
 150
150 -
 151
151 -
 152
152 -
 153
153 -
 154
154 -
 155
155 -
 156
156 -
 157
157 -
 158
158 -
 159
159 -
 160
160 -
 161
161 -
 162
162 -
 163
163 -
 164
164 -
 165
165 -
 166
166 -
 167
167 -
 168
168 -
 169
169 -
 170
170 -
171
-
172
-
173
-
174
-
175
-
176
-
177
-
178
-
179
-
180
-
181
-
182
-
183
-
184
 |
 |

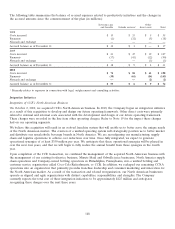
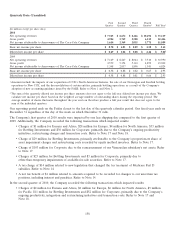
Quarterly Data (Unaudited)
First Second Third Fourth
Quarter Quarter Quarter Quarter1Full Year1
(In millions except per share data)
2010
Net operating revenues $ 7,525 $ 8,674 $ 8,426 $ 10,494 $ 35,119
Gross profit 4,984 5,719 5,508 6,215 22,426
Net income attributable to shareowners of The Coca-Cola Company 1,614 2,369 2,055 5,771 11,809
Basic net income per share $ 0.70 $ 1.03 $ 0.89 $ 2.50 $ 5.12
Diluted net income per share $ 0.69 $ 1.02 $ 0.88 $ 2.46 $ 5.062
2009
Net operating revenues $ 7,169 $ 8,267 $ 8,044 $ 7,510 $ 30,990
Gross profit 4,579 5,354 5,110 4,859 19,902
Net income attributable to shareowners of The Coca-Cola Company 1,348 2,037 1,896 1,543 6,824
Basic net income per share $ 0.58 $ 0.88 $ 0.82 $ 0.67 $ 2.95
Diluted net income per share $ 0.58 $ 0.88 $ 0.81 $ 0.66 $ 2.93
1Amounts include the impacts of our acquisition of CCE’s North American business, the sale of our Norwegian and Swedish bottling
operations to New CCE, and the deconsolidation of certain entities, primarily bottling operations, as a result of the Company’s
adoption of new accounting guidance issued by the FASB. Refer to Note 1 and Note 2.
2The sum of the quarterly diluted net income per share amounts does not agree to the full year diluted net income per share. We
calculate net income per share based on the weighted average number of outstanding shares during the reporting period. The
average number of shares fluctuates throughout the year and can therefore produce a full year result that does not agree to the
sum of the individual quarters.
Our reporting period ends on the Friday closest to the last day of the quarterly calendar period. Our fiscal year ends on
December 31 regardless of the day of the week on which December 31 falls.
The Company’s first quarter of 2010 results were impacted by one less shipping day compared to the first quarter of
2009. Additionally, the Company recorded the following transactions which impacted results:
• Charges of $1 million for Eurasia and Africa, $28 million for Europe, $4 million for North America, $33 million
for Bottling Investments and $30 million for Corporate, primarily due to the Company’s ongoing productivity
initiatives, restructuring charges and transaction costs. Refer to Note 17 and Note 18.
• Charge of $29 million for Bottling Investments, primarily attributable to the Company’s proportionate share of
asset impairment charges and restructuring costs recorded by equity method investees. Refer to Note 17.
• Charge of $103 million for Corporate due to the remeasurement of our Venezuelan subsidiary’s net assets. Refer
to Note 17.
• Charges of $23 million for Bottling Investments and $3 million for Corporate, primarily due to
other-than-temporary impairments of available-for-sale securities. Refer to Note 17.
• A tax charge of $14 million related to new legislation that changed the tax treatment of Medicare Part D
subsidies. Refer to Note 14.
• A net tax benefit of $1 million related to amounts required to be recorded for changes to our uncertain tax
positions, including interest and penalties. Refer to Note 14.
In the second quarter of 2010, the Company recorded the following transactions which impacted results:
• Charges of $2 million for Eurasia and Africa, $2 million for Europe, $6 million for North America, $5 million
for Pacific, $11 million for Bottling Investments and $52 million for Corporate, primarily due to the Company’s
ongoing productivity, integration and restructuring initiatives and transaction costs. Refer to Note 17 and
Note 18.
158