Coca Cola 2010 Annual Report Download - page 83
Download and view the complete annual report
Please find page 83 of the 2010 Coca Cola annual report below. You can navigate through the pages in the report by either clicking on the pages listed below, or by using the keyword search tool below to find specific information within the annual report.-
 1
1 -
2
-
3
-
4
-
5
-
6
-
7
-
8
-
9
-
10
-
11
-
12
-
13
-
14
-
15
-
16
-
17
-
18
-
19
-
20
-
21
-
22
-
23
-
24
-
25
-
26
-
27
-
28
-
29
-
30
-
31
-
32
-
33
-
34
-
35
-
36
-
37
-
38
-
39
-
40
-
41
-
42
-
43
-
44
-
45
-
46
-
47
-
48
-
49
-
50
-
51
-
52
-
53
-
54
-
55
-
56
-
57
-
58
-
59
-
60
-
61
-
62
-
63
-
64
-
65
-
66
-
67
-
68
-
69
-
70
-
71
-
72
-
 73
73 -
 74
74 -
 75
75 -
 76
76 -
 77
77 -
 78
78 -
 79
79 -
 80
80 -
 81
81 -
 82
82 -
 83
83 -
 84
84 -
 85
85 -
 86
86 -
 87
87 -
 88
88 -
 89
89 -
 90
90 -
 91
91 -
 92
92 -
 93
93 -
94
-
95
-
96
-
97
-
98
-
99
-
100
-
101
-
102
-
103
-
104
-
105
-
106
-
107
-
108
-
109
-
110
-
111
-
112
-
113
-
114
-
115
-
116
-
117
-
118
-
119
-
120
-
121
-
122
-
123
-
124
-
125
-
126
-
127
-
128
-
129
-
130
-
131
-
132
-
133
-
134
-
135
-
136
-
137
-
138
-
139
-
140
-
141
-
142
-
143
-
144
-
145
-
146
-
147
-
148
-
149
-
150
-
151
-
152
-
153
-
154
-
155
-
156
-
157
-
158
-
159
-
160
-
161
-
162
-
163
-
164
-
165
-
166
-
167
-
168
-
169
-
170
-
171
-
172
-
173
-
174
-
175
-
176
-
177
-
178
-
179
-
180
-
181
-
182
-
183
-
184
 |
 |

As of December 31, 2010, the projected benefit obligation of all pension plans other than the U.S. qualified pension
plans was approximately $2,455 million, and the fair value of all other pension plan assets was approximately
$1,379 million. The majority of this underfunding is attributable to an international pension plan for certain non-U.S.
employees that is unfunded due to tax law restrictions, as well as our unfunded U.S. nonqualified pension plans. These
U.S. nonqualified pension plans provide, for certain associates, benefits that are not permitted to be funded through a
qualified plan because of limits imposed by the Internal Revenue Code of 1986. The expected benefit payments for
these unfunded pension plans are not included in the table above. However, we anticipate annual benefit payments for
these unfunded pension plans to be approximately $50 million in 2011 and remain near that level through 2030,
decreasing annually thereafter. Refer to Note 13 of Notes to Consolidated Financial Statements.
In general, we are self-insured for large portions of many different types of claims; however, we do use commercial
insurance above our self-insured retentions to reduce the Company’s risk of catastrophic loss. Our reserves for the
Company’s self-insured losses are estimated through actuarial procedures of the insurance industry and by using
industry assumptions, adjusted for our specific expectations based on our claim history. As of December 31, 2010, our
self-insurance reserves totaled approximately $502 million. Refer to Note 11 of Notes to Consolidated Financial
Statements. We did not include estimated payments related to our self-insurance reserves in the table above.
Deferred income tax liabilities as of December 31, 2010, were approximately $4,279 million. Refer to Note 14 of Notes
to Consolidated Financial Statements. This amount is not included in the total contractual obligations table because we
believe this presentation would not be meaningful. Deferred income tax liabilities are calculated based on temporary
differences between the tax bases of assets and liabilities and their respective book bases, which will result in taxable
amounts in future years when the liabilities are settled at their reported financial statement amounts. The results of
these calculations do not have a direct connection with the amount of cash taxes to be paid in any future periods. As a
result, scheduling deferred income tax liabilities as payments due by period could be misleading, because this scheduling
would not relate to liquidity needs.
Foreign Exchange
Our international operations are subject to certain opportunities and risks, including currency fluctuations and
governmental actions. We closely monitor our operations in each country and seek to adopt appropriate strategies that
are responsive to changing economic and political environments, and to fluctuations in foreign currencies.
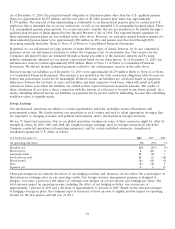
We use 75 functional currencies. Due to our global operations, weakness in some of these currencies might be offset by
strength in others. In 2010, 2009 and 2008, the weighted-average exchange rates for foreign currencies in which the
Company conducted operations (all operating currencies), and for certain individual currencies, strengthened
(weakened) against the U.S. dollar as follows:
Year Ended December 31, 2010 2009 2008
All operating currencies 3% (9)% 5%
Brazilian real 11% (8)% 6%
Mexican peso 6(24) 0
Australian dollar 13 (8) 1
South African rand 11 (1) (18)
British pound (2) (18) (9)
Euro (5) (8) 9
Japanese yen 6912
These percentages do not include the effects of our hedging activities and, therefore, do not reflect the actual impact of
fluctuations in exchange rates on our operating results. Our foreign currency management program is designed to
mitigate, over time, a portion of the impact of exchange rate changes on our net income and earnings per share. The
total currency impact on operating income, including the effect of our hedging activities, was an increase of
approximately 3 percent in 2010 and a decrease of approximately 11 percent in 2009. Based on the anticipated impact
of hedging coverage in place, the Company expects currencies to have an even to slightly positive impact on operating
income for the first quarter and full year of 2011.
81