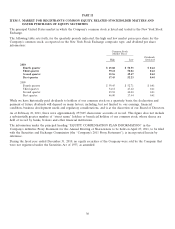
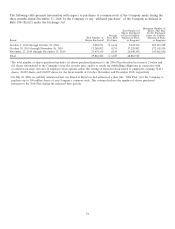
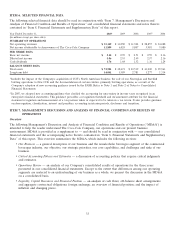
Coca Cola 2010 Annual Report Download - page 34
Download and view the complete annual report
Please find page 34 of the 2010 Coca Cola annual report below. You can navigate through the pages in the report by either clicking on the pages listed below, or by using the keyword search tool below to find specific information within the annual report.-
 1
1 -
2
-
3
-
4
-
5
-
6
-
7
-
8
-
9
-
10
-
11
-
12
-
13
-
14
-
15
-
16
-
17
-
18
-
19
-
20
-
21
-
22
-
23
-
 24
24 -
 25
25 -
 26
26 -
 27
27 -
 28
28 -
 29
29 -
 30
30 -
 31
31 -
 32
32 -
 33
33 -
 34
34 -
 35
35 -
 36
36 -
 37
37 -
 38
38 -
 39
39 -
 40
40 -
 41
41 -
 42
42 -
 43
43 -
 44
44 -
45
-
46
-
47
-
48
-
49
-
50
-
51
-
52
-
53
-
54
-
55
-
56
-
57
-
58
-
59
-
60
-
61
-
62
-
63
-
64
-
65
-
66
-
67
-
68
-
69
-
70
-
71
-
72
-
73
-
74
-
75
-
76
-
77
-
78
-
79
-
80
-
81
-
82
-
83
-
84
-
85
-
86
-
87
-
88
-
89
-
90
-
91
-
92
-
93
-
94
-
95
-
96
-
97
-
98
-
99
-
100
-
101
-
102
-
103
-
104
-
105
-
106
-
107
-
108
-
109
-
110
-
111
-
112
-
113
-
114
-
115
-
116
-
117
-
118
-
119
-
120
-
121
-
122
-
123
-
124
-
125
-
126
-
127
-
128
-
129
-
130
-
131
-
132
-
133
-
134
-
135
-
136
-
137
-
138
-
139
-
140
-
141
-
142
-
143
-
144
-
145
-
146
-
147
-
148
-
149
-
150
-
151
-
152
-
153
-
154
-
155
-
156
-
157
-
158
-
159
-
160
-
161
-
162
-
163
-
164
-
165
-
166
-
167
-
168
-
169
-
170
-
171
-
172
-
173
-
174
-
175
-
176
-
177
-
178
-
179
-
180
-
181
-
182
-
183
-
184
 |
 |
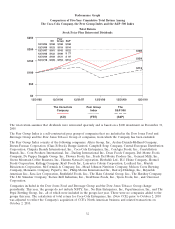
25FEB201119464159
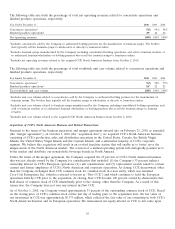
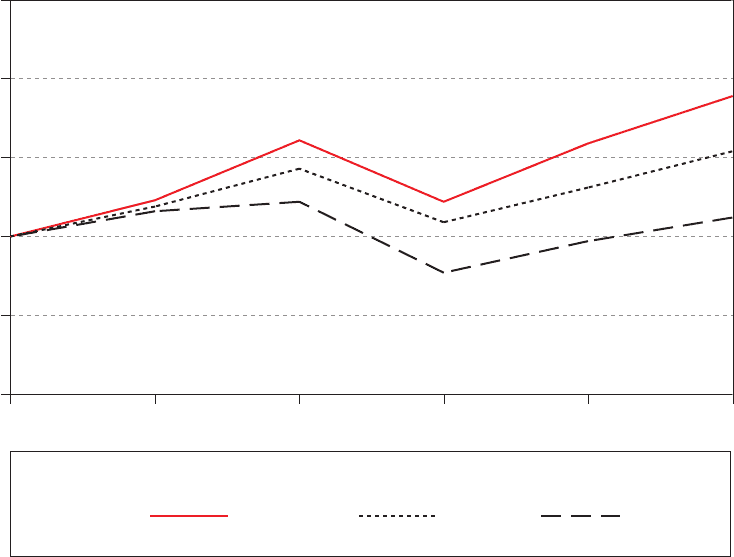
Performance Graph
Comparison of Five-Year Cumulative Total Return Among
The Coca-Cola Company, the Peer Group Index and the S&P 500 Index
Total Return
Stock Price Plus Reinvested Dividends
$0
$50
$100
$150
$250
$200
12/31/05 12/31/06 12/31/07 12/31/08
$154
$189
$112
12/31/05
12/31/06
12/31/07
12/31/08
12/31/09
12/31/10
Peer
Group
$100
$119
$143
$109
$131
$154
KO
$100
$123
$161
$122
$159
$189
S&P
$100
$116
$122
$ 97
$ 77
$112
12/31/09 12/31/10
The Coca-Cola
Company
(KO) (FBT)
Peer Group
Index
(S&P)
The
S&P 500
The total return assumes that dividends were reinvested quarterly and is based on a $100 investment on December 31,
2005.
The Peer Group Index is a self-constructed peer group of companies that are included in the Dow Jones Food and
Beverage Group and the Dow Jones Tobacco Group of companies, from which the Company has been excluded.
The Peer Group Index consists of the following companies: Altria Group, Inc., Archer-Daniels-Midland Company,
Brown-Forman Corporation (Class B Stock), Bunge Limited, Campbell Soup Company, Central European Distribution
Corporation, Chiquita Brands International, Inc., Coca-Cola Enterprises, Inc., ConAgra Foods, Inc., Constellation
Brands, Inc., Corn Products International, Inc., Darling International Inc., Dean Foods Company, Del Monte Foods
Company, Dr Pepper Snapple Group, Inc., Flowers Foods, Inc., Fresh Del Monte Produce Inc., General Mills, Inc.,
Green Mountain Coffee Roasters, Inc., Hansen Natural Corporation, Herbalife Ltd., H.J. Heinz Company, Hormel
Foods Corporation, Kellogg Company, Kraft Foods Inc., Lancaster Colony Corporation, Lorillard, Inc., Martek
Biosciences Corporation, McCormick & Company, Inc., Mead Johnson Nutrition Company, Molson Coors Brewing
Company, Monsanto Company, PepsiCo, Inc., Philip Morris International Inc., Ralcorp Holdings, Inc., Reynolds
American Inc., Sara Lee Corporation, Smithfield Foods, Inc., The Hain Celestial Group, Inc., The Hershey Company,
The J.M. Smucker Company, Tootsie Roll Industries, Inc., TreeHouse Foods, Inc., Tyson Foods, Inc., and Universal
Corporation.
Companies included in the Dow Jones Food and Beverage Group and the Dow Jones Tobacco Group change
periodically. This year, the groups do not include NBTY, Inc., Nu Skin Enterprises, Inc., PepsiAmericas, Inc., and The
Pepsi Bottling Group, Inc., all of which were included in the groups last year. There were no companies added to the
groups this year. The calculation of total return for Coca-Cola Enterprises, Inc. (New CCE) prior to October 2, 2010
was adjusted to reflect the Company’s acquisition of CCE’s North American business and related transactions on
October 2, 2010.
32