Coca Cola 2010 Annual Report Download - page 60
Download and view the complete annual report
Please find page 60 of the 2010 Coca Cola annual report below. You can navigate through the pages in the report by either clicking on the pages listed below, or by using the keyword search tool below to find specific information within the annual report.-
 1
1 -
2
-
3
-
4
-
5
-
6
-
7
-
8
-
9
-
10
-
11
-
12
-
13
-
14
-
15
-
16
-
17
-
18
-
19
-
20
-
21
-
22
-
23
-
24
-
25
-
26
-
27
-
28
-
29
-
30
-
31
-
32
-
33
-
34
-
35
-
36
-
37
-
38
-
39
-
40
-
41
-
42
-
43
-
44
-
45
-
46
-
47
-
48
-
49
-
 50
50 -
 51
51 -
 52
52 -
 53
53 -
 54
54 -
 55
55 -
 56
56 -
 57
57 -
 58
58 -
 59
59 -
 60
60 -
 61
61 -
 62
62 -
 63
63 -
 64
64 -
 65
65 -
 66
66 -
 67
67 -
 68
68 -
 69
69 -
 70
70 -
71
-
72
-
73
-
74
-
75
-
76
-
77
-
78
-
79
-
80
-
81
-
82
-
83
-
84
-
85
-
86
-
87
-
88
-
89
-
90
-
91
-
92
-
93
-
94
-
95
-
96
-
97
-
98
-
99
-
100
-
101
-
102
-
103
-
104
-
105
-
106
-
107
-
108
-
109
-
110
-
111
-
112
-
113
-
114
-
115
-
116
-
117
-
118
-
119
-
120
-
121
-
122
-
123
-
124
-
125
-
126
-
127
-
128
-
129
-
130
-
131
-
132
-
133
-
134
-
135
-
136
-
137
-
138
-
139
-
140
-
141
-
142
-
143
-
144
-
145
-
146
-
147
-
148
-
149
-
150
-
151
-
152
-
153
-
154
-
155
-
156
-
157
-
158
-
159
-
160
-
161
-
162
-
163
-
164
-
165
-
166
-
167
-
168
-
169
-
170
-
171
-
172
-
173
-
174
-
175
-
176
-
177
-
178
-
179
-
180
-
181
-
182
-
183
-
184
 |
 |

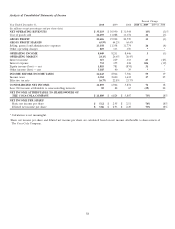
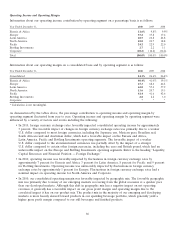
Analysis of Consolidated Statements of Income
Percent Change
Year Ended December 31, 2010 2009 2008 2010 vs. 2009 2009 vs. 2008
(In millions except percentages and per share data)
NET OPERATING REVENUES $ 35,119 $ 30,990 $ 31,944 13% (3)%
Cost of goods sold 12,693 11,088 11,374 14 (3)
GROSS PROFIT 22,426 19,902 20,570 13 (3)
GROSS PROFIT MARGIN 63.9% 64.2% 64.4%
Selling, general and administrative expenses 13,158 11,358 11,774 16 (4)
Other operating charges 819 313 350 **
OPERATING INCOME 8,449 8,231 8,446 3(3)
OPERATING MARGIN 24.1% 26.6% 26.4%
Interest income 317 249 333 27 (25)
Interest expense 733 355 438 106 (19)
Equity income (loss) — net 1,025 781 (874) 31 *
Other income (loss) — net 5,185 40 39 **
INCOME BEFORE INCOME TAXES 14,243 8,946 7,506 59 19
Income taxes 2,384 2,040 1,632 17 25
Effective tax rate 16.7% 22.8% 21.7%
CONSOLIDATED NET INCOME 11,859 6,906 5,874 72 18
Less: Net income attributable to noncontrolling interests 50 82 67 (39) 22
NET INCOME ATTRIBUTABLE TO SHAREOWNERS OF
THE COCA-COLA COMPANY $ 11,809 $ 6,824 $ 5,807 73% 18%
NET INCOME PER SHARE1
Basic net income per share $ 5.12 $ 2.95 $ 2.51 74% 18%
Diluted net income per share $ 5.06 $ 2.93 $ 2.49 73% 18%
* Calculation is not meaningful.
1Basic net income per share and diluted net income per share are calculated based on net income attributable to shareowners of
The Coca-Cola Company.
58