Coca Cola 2010 Annual Report Download - page 59
Download and view the complete annual report
Please find page 59 of the 2010 Coca Cola annual report below. You can navigate through the pages in the report by either clicking on the pages listed below, or by using the keyword search tool below to find specific information within the annual report.-
 1
1 -
2
-
3
-
4
-
5
-
6
-
7
-
8
-
9
-
10
-
11
-
12
-
13
-
14
-
15
-
16
-
17
-
18
-
19
-
20
-
21
-
22
-
23
-
24
-
25
-
26
-
27
-
28
-
29
-
30
-
31
-
32
-
33
-
34
-
35
-
36
-
37
-
38
-
39
-
40
-
41
-
42
-
43
-
44
-
45
-
46
-
47
-
48
-
 49
49 -
 50
50 -
 51
51 -
 52
52 -
 53
53 -
 54
54 -
 55
55 -
 56
56 -
 57
57 -
 58
58 -
 59
59 -
 60
60 -
 61
61 -
 62
62 -
 63
63 -
 64
64 -
 65
65 -
 66
66 -
 67
67 -
 68
68 -
 69
69 -
70
-
71
-
72
-
73
-
74
-
75
-
76
-
77
-
78
-
79
-
80
-
81
-
82
-
83
-
84
-
85
-
86
-
87
-
88
-
89
-
90
-
91
-
92
-
93
-
94
-
95
-
96
-
97
-
98
-
99
-
100
-
101
-
102
-
103
-
104
-
105
-
106
-
107
-
108
-
109
-
110
-
111
-
112
-
113
-
114
-
115
-
116
-
117
-
118
-
119
-
120
-
121
-
122
-
123
-
124
-
125
-
126
-
127
-
128
-
129
-
130
-
131
-
132
-
133
-
134
-
135
-
136
-
137
-
138
-
139
-
140
-
141
-
142
-
143
-
144
-
145
-
146
-
147
-
148
-
149
-
150
-
151
-
152
-
153
-
154
-
155
-
156
-
157
-
158
-
159
-
160
-
161
-
162
-
163
-
164
-
165
-
166
-
167
-
168
-
169
-
170
-
171
-
172
-
173
-
174
-
175
-
176
-
177
-
178
-
179
-
180
-
181
-
182
-
183
-
184
 |
 |
Unit case volume in North America decreased 2 percent, which reflected the impact of a difficult U.S. economic
environment and a competitive pricing environment. The effect of the economic environment and pricing environment
was partially offset by the impact of strong customer and consumer programs. North America’s unit case volume decline
consisted of a 3 percent decline in sparkling beverages, partially offset by 1 percent growth in still beverages. The
decline in sparkling beverages was partly attributable to the significant price increase taken by bottlers in the fourth
quarter of 2008. The decline was partially offset by the continued strong performance of Coca-Cola Zero, which had
unit case volume growth of 19 percent. Still beverage unit case volume growth was primarily due to the strong
performance of Fuze Beverage, LLC (‘‘Fuze’’), Trademark Simply and tea. The unit case volume growth in still
beverages was reduced by a double-digit volume decline in the North American water businesses, including Trademark
Dasani, primarily due to the slowing water category and the Company’s decision to not pursue unprofitable volume
opportunities in bulk water/case packs in North America.
In Pacific, unit case volume increased 7 percent, which consisted of growth in sparkling and still beverages of 6 percent
and 8 percent, respectively. Sparkling beverage growth in Pacific included 14 percent growth in Trademark Sprite and
5 percent growth in Trademark Coca-Cola. The group’s volume growth was led by 16 percent growth in China, which
reflected 11 percent growth in sparkling beverages and 30 percent growth in still beverages. China’s sparkling beverage
volume growth was led by double-digit growth in Trademark Sprite and 6 percent growth in Trademark Coca-Cola.
China’s still beverage volume growth was led by double-digit growth in Minute Maid. The unit case volume growth in
China was partially offset by a 2 percent volume decline in Japan, primarily due to the continued severe economic
challenges and unfavorable weather conditions during what are traditionally high-volume months. Sparkling beverage
volume in Japan was even, while still beverages declined 3 percent. The decline in still beverages included the impact of
a 5 percent volume decline in Aquarius and a 3 percent decline in Georgia Coffee. Due to the weak economy, Georgia
Coffee was negatively impacted by shifts away from the at-work vending channel. The group’s volume increase also
included a 1 percent increase in the Philippines.
Unit case volume for Bottling Investments increased 2 percent, primarily due to the impact of unit case volume growth
of 16 percent in China, 31 percent in India and 1 percent in the Philippines. The Company’s consolidated bottling
operations account for approximately 33 percent, 65 percent and 100 percent of the unit case volume in China, India
and the Philippines, respectively. The favorable impact of unit case volume in these markets was partially offset by the
sale of certain bottling operations during 2008, including Refrigerantes Minas Gerais Ltda. (‘‘Remil’’), a bottler in
Brazil, and the sale of a portion of our ownership interest in Coca-Cola Beverages Pakistan Ltd. (‘‘Coca-Cola
Pakistan’’), which resulted in its deconsolidation. Refer to Note 17 of Notes to Consolidated Financial Statements. In
addition, Germany’s unit case volume declined 2 percent. The Company’s consolidated bottling operations account for
100 percent of the unit case volume in Germany.
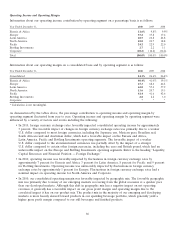
Concentrate Sales Volume
In 2010, concentrate sales volume and unit case volume both grew 5 percent compared to 2009. In 2009, concentrate
sales volume and unit case volume both grew 3 percent compared to 2008. The differences between concentrate sales
volume and unit case volume growth rates for individual operating segments in 2010 and 2009 were primarily due to the
timing of concentrate shipments and the impact of unit case volume from certain joint ventures in which the Company
has an equity interest, but to which the Company does not sell concentrates, syrups, beverage bases or powders.
57