Coca Cola 2010 Annual Report Download - page 153
Download and view the complete annual report
Please find page 153 of the 2010 Coca Cola annual report below. You can navigate through the pages in the report by either clicking on the pages listed below, or by using the keyword search tool below to find specific information within the annual report.-
 1
1 -
2
-
3
-
4
-
5
-
6
-
7
-
8
-
9
-
10
-
11
-
12
-
13
-
14
-
15
-
16
-
17
-
18
-
19
-
20
-
21
-
22
-
23
-
24
-
25
-
26
-
27
-
28
-
29
-
30
-
31
-
32
-
33
-
34
-
35
-
36
-
37
-
38
-
39
-
40
-
41
-
42
-
43
-
44
-
45
-
46
-
47
-
48
-
49
-
50
-
51
-
52
-
53
-
54
-
55
-
56
-
57
-
58
-
59
-
60
-
61
-
62
-
63
-
64
-
65
-
66
-
67
-
68
-
69
-
70
-
71
-
72
-
73
-
74
-
75
-
76
-
77
-
78
-
79
-
80
-
81
-
82
-
83
-
84
-
85
-
86
-
87
-
88
-
89
-
90
-
91
-
92
-
93
-
94
-
95
-
96
-
97
-
98
-
99
-
100
-
101
-
102
-
103
-
104
-
105
-
106
-
107
-
108
-
109
-
110
-
111
-
112
-
113
-
114
-
115
-
116
-
117
-
118
-
119
-
120
-
121
-
122
-
123
-
124
-
125
-
126
-
127
-
128
-
129
-
130
-
131
-
132
-
133
-
134
-
135
-
136
-
137
-
138
-
139
-
140
-
141
-
142
-
 143
143 -
 144
144 -
 145
145 -
 146
146 -
 147
147 -
 148
148 -
 149
149 -
 150
150 -
 151
151 -
 152
152 -
 153
153 -
 154
154 -
 155
155 -
 156
156 -
 157
157 -
 158
158 -
 159
159 -
 160
160 -
 161
161 -
 162
162 -
 163
163 -
164
-
165
-
166
-
167
-
168
-
169
-
170
-
171
-
172
-
173
-
174
-
175
-
176
-
177
-
178
-
179
-
180
-
181
-
182
-
183
-
184
 |
 |

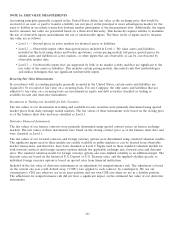
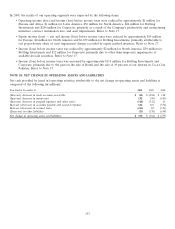
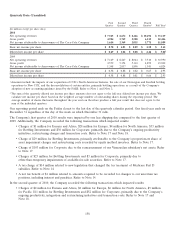
Information about our Company’s operations by operating segment for the years ended December 31, 2010, 2009 and
2008, is as follows (in millions):
Eurasia & Latin North Bottling
Africa Europe America America Pacific Investments Corporate Eliminations Consolidated
2010
Net operating revenues:
Third party $ 2,426 $ 4,424 $ 3,880 $ 11,140 $ 4,9411$ 8,216 $ 92 $ — $ 35,119
Intersegment 130 825 241 65 330 97 — (1,688) —
Total net revenues 2,556 5,249 4,121 11,205 5,271 8,313 92 (1,688) 35,119
Operating income (loss) 980 2,976 2,405 1,520 2,048 227 (1,707) — 8,449
Interest income — — — — — — 317 — 317
Interest expense — — — — — — 733 — 733
Depreciation and amortization 31 106 54 575 101 430 146 — 1,443
Equity income (loss) — net 18 33 24 (4) 1 971 (18) — 1,025
Income (loss) before income taxes 1,000 3,020 2,426 1,523 2,049 1,205 3,020 — 14,243
Identifiable operating assets21,278 2,72432,298 32,793 1,827 8,398316,018 — 65,336
Investments4291 243 379 57 123 6,426 66 — 7,585
Capital expenditures 59 33 94 711 101 942 275 — 2,215
2009
Net operating revenues:
Third party $ 1,977 $ 4,308 $ 3,700 $ 8,191 $ 4,5331$ 8,193 $ 88 $ — $ 30,990
Intersegment 220 895 182 80 342 127 — (1,846) —
Total net revenues 2,197 5,203 3,882 8,271 4,875 8,320 88 (1,846) 30,990
Operating income (loss) 810 2,946 2,042 1,699 1,887 179 (1,332) — 8,231
Interest income — — — — — — 249 — 249
Interest expense — — — — — — 355 — 355
Depreciation and amortization 27 132 52 365 95 424 141 — 1,236
Equity income (loss) — net (1) 20 (4) (1) (23) 785 5 — 781
Income (loss) before income taxes 810 2,976 2,039 1,701 1,866 980 (1,426) — 8,946
Identifiable operating assets21,155 3,04732,480 10,941 1,929 9,140313,224 — 41,916
Investments4331 214 248 8 82 5,809 63 — 6,755
Capital expenditures 70 68 123 458 91 826 357 — 1,993
2008
Net operating revenues:
Third party $ 2,135 $ 4,785 $ 3,623 $ 8,205 $ 4,3581$ 8,731 $ 107 $ — $ 31,944
Intersegment 192 1,016 212 75 337 200 — (2,032) —
Total net revenues 2,327 5,801 3,835 8,280 4,695 8,931 107 (2,032) 31,944
Operating income (loss) 834 3,175 2,099 1,584 1,858 264 (1,368) — 8,446
Interest income — — — — — — 333 — 333
Interest expense — — — — — — 438 — 438
Depreciation and amortization 26 169 42 376 78 409 128 — 1,228
Equity income (loss) — net (14) (4) 6 (2) (19) (844) 3 — (874)
Income (loss) before income taxes 823 3,182 2,098 1,579 1,841 (582) (1,435) — 7,506
Identifiable operating assets2956 3,01231,849 10,845 1,444 7,93538,699 — 34,740
Investments4395 179 199 4 72 4,873 57 — 5,779
Capital expenditures 67 76 58 493 177 818 279 — 1,968
1Net operating revenues in Japan represented approximately 9 percent of total consolidated net operating revenues in 2010,
10 percent in 2009 and 9 percent in 2008.
2Principally cash and cash equivalents, trade accounts receivable, inventories, goodwill, trademarks and other intangible assets and
property, plant and equipment — net.
3Property, plant and equipment — net in Germany represented approximately 10 percent of total consolidated property, plant and
equipment — net in 2010, 18 percent in 2009 and 18 percent in 2008.
4Principally equity method investments, available-for-sale securities and nonmarketable investments in bottling companies.
151